35 buckets | Crop protection products are critical to sustaining the world, but there are many things that need to be done to meet the global food needs of 2050, while protecting the environment and meeting the challenges of climate change.
Editor’s note: This article is from WeChat public account “35 bucket” (ID: vcearth), the author Luo Jianjun.
The publication of Rachel Carson’s “Silent Spring” in 1962 is an important milestone in the development of the crop protection industry.
It emphasizes the urgency of improving the safety and environmental status of pesticide products, and its enormous public and political impact has played an important role in the establishment of the US Environmental Protection Agency (EPA).
Today, the world’s leading manufacturers of crop protection products invest more than $3 billion annually in research and development of new products.
Over the past 50 years, the total research and development investment of major research companies has remained at a high of 7%-10% of annual sales (Phillips McDougall AgriService).
This high level of investment allows companies to continue to develop and improve the efficacy and safety of their products to ensure that they continue to raise regulatory standards and provide farmers with effective tools to provide nutrition, safety and affordability. Food.
To illustrate how this industry has evolved, it is helpful to compare key historical data on all aspects of the crop protection industry before and after the release of Silent Spring and its current state of affairs.
Industry size and product diversity
In 1960, the value of the crop protection industry was less than $10 billion, and farmers were able to get about 100 pesticide active ingredients. Today, the industry is worth more than $50 billion, and there are about 600 active ingredients available to farmers around the world (Figure 1).
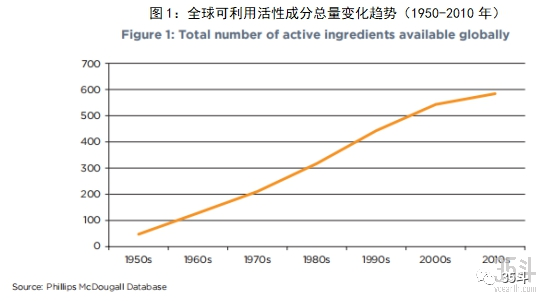
In addition, there were 15 in the market in 1960 Chemical group, and today’s products come from more than 40 different groups. New chemical groups often bring new ways of action that are important to address the resistance of pesticides, fungicides or herbicides.
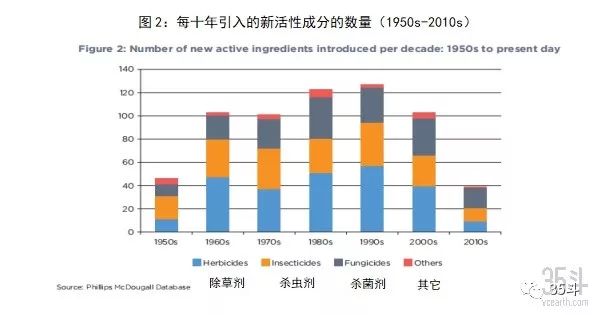
Although the approval rate of new products has declined in recent years (Figure 2), the scale of investment is still large, which enables the industry to maintain a level of product innovation and other developments, such asCrop solutions, applied technology and precision agriculture.
This high level of R&D investment began in the 1950s, and in the past 50 years, large companies have invested 7%-10% of their sales (Phillips McDougall AgriService) each year.
To keep up with new security regulations, many years A large number of products have been withdrawn from the market, and these products are either banned or unsupported during the re-registration process.
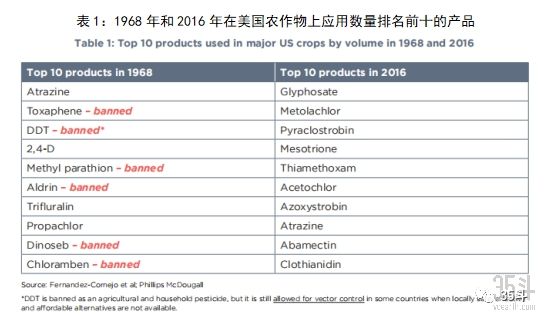
For example, the US Environmental Protection Agency (EPA) lists more than 60 active ingredients that are no longer available in the United States. The impact can be illustrated by comparing the top 10 products used in the 1968 US major crops with the products used in 2016 (Table 1).
Six of the top ten products used in 1968 are now banned.
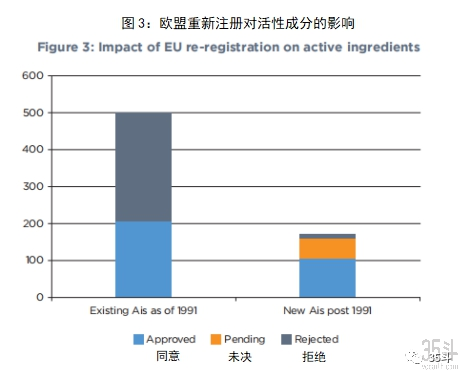
In the EU, the regulatory system changes More stringent data requirements have been introduced, hazard deadlines have been introduced, and sophisticated technical guidance procedures have been used for risk assessment, thereby reducing the number of new active substances registered in the EU, and those already on the market are unlikely to meet The requirements of the new standard.
According to Directive 91/414 of 1991, the EU’s re-registration process resulted in the removal of more than half of the commercially active crop protection active ingredients (293 out of 499) (Figure 3).
It is worth noting that although in the past Used in traditional works for 20 yearsThe number of new active ingredients protected by substances is declining, but the number of biological products on the market is increasing rapidly.
It is also important to note that although the crop protection industry has greatly improved the efficacy and safety of new products, the national regulatory systems associated with trade secret information for new products in low-income countries are often inadequately protected and may jeopardize the industry. The investment, stifling innovation, sometimes makes it impossible for farmers to acquire new technology.
Biological products are emerging
In addition to more than 600 synthetic crop protection active ingredients, there are approximately 300 biopesticides actives and organisms. These substances include naturally occurring substances, products produced by fermentation, microorganisms and pheromones, as well as carnivorous insects, mites, fungi and nematodes.
In recent years, interest in biological products has increased significantly, both in large R&D companies, in non-patent product manufacturers, and in many smaller companies and start-ups.
This trend is driven by lower demanding regulatory procedures, increased pest management (IPM) projects, and farmers’ demand for more diverse toolboxes for biopesticide. In IPM systems, biopesticides and synthetic pesticides are often used simultaneously.
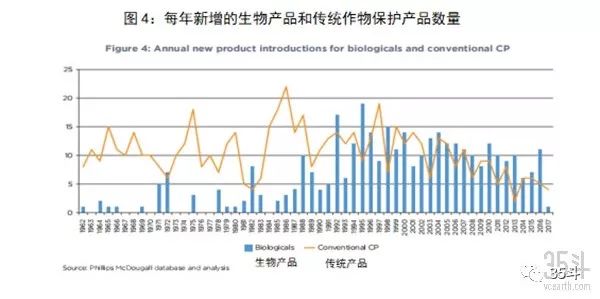
Since 1960, the introduction rate of biological products has increased significantly (Figure 4). Between 1960 and 1990, an average of three new biological products entered the global market each year. From 1990 to 2016, an average of 11 new biological agents were introduced each year.
In the past 20 years, new bio-products have been introduced more often than traditional products, and this trend seems to continue.
In terms of patent activities, 2017 was a biopesticide patent (173 items), surpassing traditional crop protection products (117 items) for the first time.
The market for bioproducts is also growing faster than traditional Crop protection products are growing fast, increasing by 2900% since the early 1990s, albeit at a low starting point (Table 2).
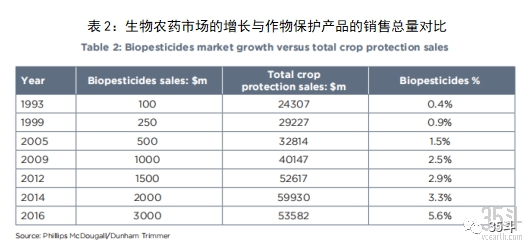
Although the potential is huge and has grown rapidly in recent years, the market share of the biological products is relatively small. The total value of the entire crop protection product market accounts for less than 10%.
In addition, the average annual sales of a biological product at maturity is about $10 million, while the average annual sales of traditional crop protection products is $75 million. For the sector to continue to grow, bioproducts will need to prove their efficacy in time and scale.
Since the 1950s, substantial investments in crop protection products have increased their effectiveness and efficiency.
For example, as the product develops, the application per hectare is significantly reduced, so farmers can use lower dose crop protection products to achieve the same effect (Figure 5).
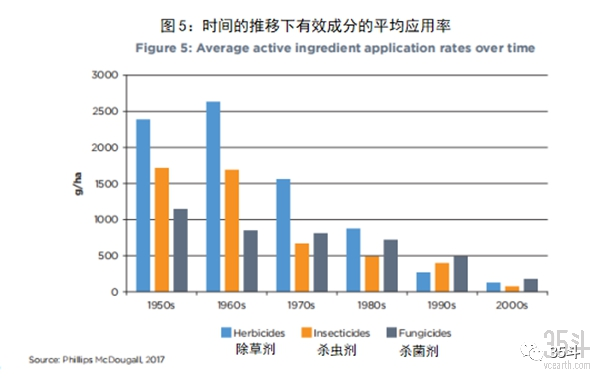
The 1950s, pesticides per hectare The average application rates of insecticides and herbicides were 1200 grams, 1700 grams and 2400 grams, respectively.
In the first decade of this century, the average usage rate was reduced to 100, 40 and 75 g/ha. Advances in this technology mean that the active ingredients used by farmers today are about 95% lower than in the 1950s.
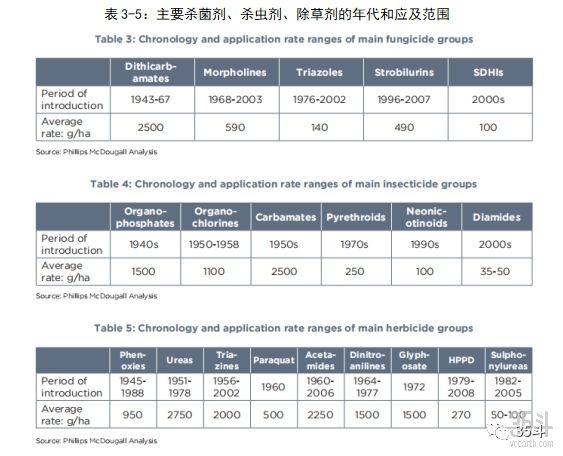
The average application rates of different chemical classes of herbicides, insecticides and fungicides over time are shown in Tables 3-5.
< Strong>Health, safety and environmental impacts and response measures
In order for crop protection products to pass regulatory requirements and be approved for commercial use, R&D institutions and manufacturers must demonstrate that they can be safely disposed of and used, minimizing risks to human health and the environment.
As mentioned earlier, products that enter the market today have seen significant improvements in human and environmental safety around security regulatory standards and increased social expectations.
Innovation in the R&D process now allows companies to screen potential active ingredients early in the development process to immediately eliminate any toxic or environmentally harmful products.
In addition, as technology advances, a new crop protection product is notedThe average number of new, biosynthetically studied molecules has increased from 52,000 in 1995 to 160,000 today.
Toxic (TOXICITY)
The World Health Organization divides pesticides into four categories:
-
Category 1: Extreme (1a) and Height (1b) Danger
-
Category 2: Moderately Dangerous
-
Category 3: Slightly Dangerous
-
U: Not likely to be dangerous
These classifications are determined by “LD50”, which is a measure of the acute toxicity of a material and is a fundamental component of product safety decisions.
The higher the LD50 value, the greater the difference in acute safety to the human body. With this in mind, the current average level of active ingredient LD50 is about 3500 mg/kg, while the average level of LD50 in the 1960s is about 2500 mg/kg, which is a 40% reduction in acute toxicity, which is a positive trend.
As a result of these improvements, the number of WHO’s new active ingredients in categories 1 and 2 is reduced today (Figure 7).
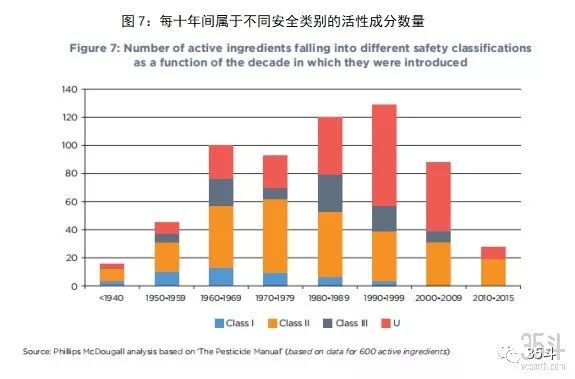
Addition of LD50 plus pesticide use The decline in rates illustrates the positive developments in the crop protection industry, which simultaneously improves product efficacy and reduces acute product toxicity.
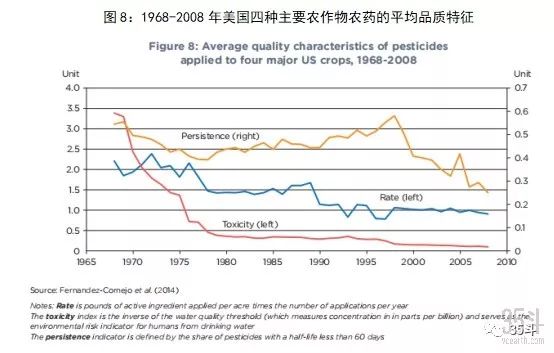
A study by Fernandez-Cornejo et al. provides another positive example (Figure 8). According to US drinking water standards, toxic levels in the United States continued to decline between 1968 and 2008.
The authors point out that “new and better pesticide active ingredients (more effective, less harmful to human health and the environment) are often introduced, while other active ingredients have been banned or voluntarily cancelled by their producers.” Span>
Persistence in soil
The impact of crop protection products on the soil is another important factor.
Crop protection products are always durable to ensure that the product is effective against its target pests in sufficient time and to reduce the application of further crop protection products. Importantly, crop protection products end up It should be degraded into harmless decomposition products in the soil.
The crop protection industry must strike a balance between product effectiveness and soil sustainability.
One indicator for measuring soil persistence is DT50, which is the number of days required for half of the product to degrade. The higher the DT50 value, the longer the persistence.
Analysis of dt50 shows that the durability of the products introduced in the 1980s peaked at 72 days. In the first decade of the 21st century, new inventions have helped reduce the durability to an average of 53 days.
Figure 8 shows an index of persistent data developed by the United States using Fernandez-Cornejo and Jans (1995). Persistence declined between the 1968 and the end of the 1970s, and then gradually increased to the end of the 1990s and then declined significantly until 2008.
These positive product development trends are supported by regulatory policies that have evolved significantly over the past 60 years to assess the persistence of pesticides.
For example, some specific pesticide products may have a small amount of retention that lasts until the next growing season. Therefore, a comprehensive environmental risk assessment is conducted to determine whether this persistence level will pass through soil transport or surface water runoff. The environment has an impact.
Contribute to crop production and food security
Crop protection products help farmers increase per mu and total production, which helps to feed a growing population and avoid putting biodiversity-rich land into production.
Figure 9 shows the total yield of all cropsHow the volume increased from just under 4 tons/ha in 1960 to just over 6 tons/ha today, an increase of about 60%. This helps increase production to meet the needs of a growing population without significantly increasing the development of arable land.
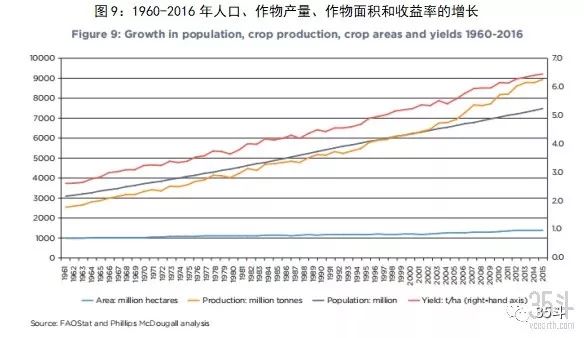
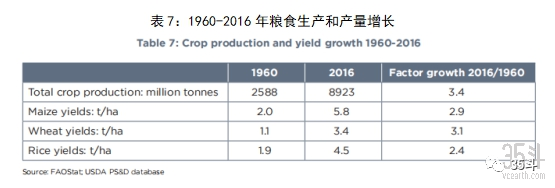
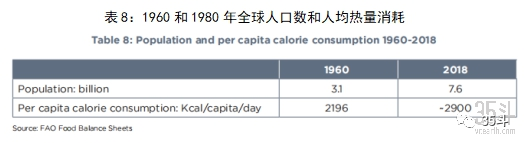
In general, global food production has more than tripled since 1960 (Table 7), most of which was due to increased food production, rather than benefiting from the expansion of land use.
Although only to increase production One of the three main inputs (the other two are fertilizers and improved seeds), but crop protection products play an important role in protecting/upgrading yields.
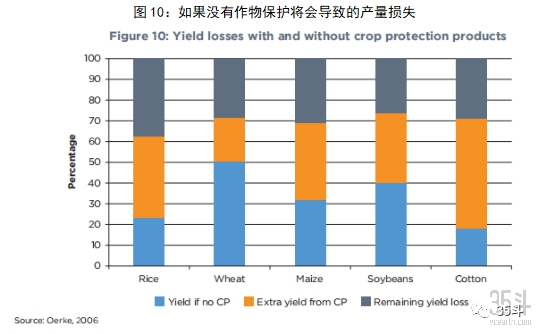
A report by FAO/OECD indicates that crop losses may reach 50% to 80% without crop protection measures including pesticides.
Figure 10 further demonstrates the value of crop protection products to maintain yield. With regard to pesticides, the increase in crop yields is likely to be the result of a combination of factors that improve formulation and application rates, increase the biological activity of pesticides, and expand the range of activity of products when controlling new pests.
Quantity of crop protection products used by farmers
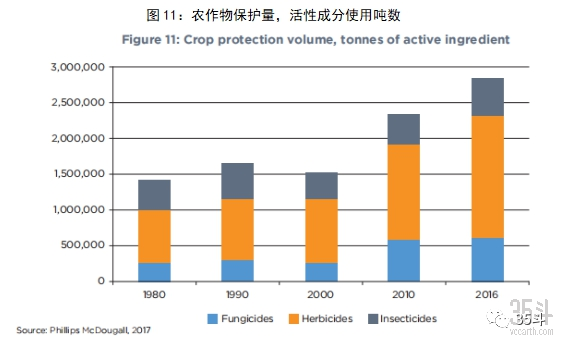
Figure 11 shows how the amount of active ingredient used globally remains constant between 1980 and 2000, as farmers are able to meet global demand for increased production without increasing usage.
Since 2008, the use of crop protection products has increased as more and more farmers demand more tools to protect their crops.
At the same time, food production per ton of active ingredient increased from 2,826 tons in 1980 to 3,145 tons in 2016 (FAO crop production data), an increase of more than 10%.
Overall, the amount of active ingredient used per ton of food produced has declined since 1980.
Some global trends help explain the overall Sales growth:
-
The rapid growth of no-till agriculture – directly planting a new crop onto the stalk of the former crop without cultivating it. The nature of no-till is the use of herbicides to control weeds (see the next chapter for more discussion on no-till).
-
Emerging economies are turning to more productive agriculture and getting relevant inputs. Since 2008, the production of crop protection products has increased by 10% in China, by 8% in India and by 6% in Latin America.
-
The food crisis from 2007 to 2008, global food prices rose sharply, global food insecurity and increased emphasis on increased production.
-
The impact of climate change, the changing environment has brought new pest problems to farmers and new solutions are needed to protect their crops.
-
According to a 2014 study, about half of the countries that planted host crops have found more than one in ten pest types. If this spread develops at the current rate, scientists worry that in the next 30 years, a large part of the world’s food producing countries will be inundated with pests.
-
A 2018 study estimated that a global average surface temperature rise of 2 degrees Celsius would result in 31% corn, 19% rice, and 46% wheat being reduced by insects.
Sustainable Agriculture
The Food and Agriculture Organization of the United Nations (FAO) estimates that by 2050, farmers will have to produce more food to meet the projected demand of more than 9 billion people, while also addressing climate change and protecting limited natural resources. Pesticides are a basic tool for farmers to cultivate in a sustainable manner, to meet growing demand and to protect the environment. ,
Integrated pest management
The global consensus is that Integrated Pest Management (IPM) is the most effective and comprehensive approach to sustainable agriculture. IPM focuses on using ecological principles to prevent problems.
When intervention is required, it focuses on managing insects, weeds, and diseases through a combination of cultural, physical, biological, and chemical methods that are cost-effective, environmentally sound, and socially acceptable. This includes responsible use of crop protection and plant biotechnology products.
The FAO definition of IPM states that pesticides should be used economically and to minimize risks to human health and the environment. IPM is also the cornerstone of the European Commission’s sustainable use of pesticides.
It defines IPM as the least damage to agro-ecosystems caused by the growth of healthy crops, and encourages natural pest control mechanisms to use pesticides only when needed.
No-Till/Conservative Farming
Another major technology that plays an important role in sustainable agriculture is no-till, which involves planting a new crop directly on the pupa of the former crop without cultivating it. The nature of no-till is the use of herbicides to control weeds, which have many benefits:
-
Avoid time-consuming, labor-intensive, energy-consuming arable land, protect soil structure, and reduce the probability of soil erosion;
-
Keep soil moisture;
-
Protection of soil biodiversity;
-
It can reduce greenhouse gas (GHG) emissions by avoiding the use of energy and interfering with isolated greenhouse gases in the soil;
-
It allows more land to be put into production because the demand for fallow is reduced.
The current widespread use of no-till measures is mainly in the United States, Canada, Brazil, Argentina and Australia, accounting for more than 90% of the world’s no-till land area (Table 9).
The largest country in the future will be China, which has more than doubled the area of conservation tillage based on data from FAO between 2011 and 2013.