Secondary market increasingly complex
Editor’s note: This article is from the micro-channel public number “really makes Rousseau” (ID: zhenjiaolujun0426), Author: Rousseau really makes the team.
The second-hand transaction data of the previous month will be released around the 10th of each month
The 10th of this month has attracted special attention. This is the first month after the opening of the new year, and it is also a small spring. In the second and third months of the market, there have been so many policy adjustments.
In other words, the transaction data in March must have symbolic significance. It is a digestion of previous policies and a signal of future trend development.
This figure is worthy of our analysis
01
How many sets were sold in March
We must first have a basic judgment on market data
Last year, about 240,000 residential units were sold in Shanghai, which is about 20,000 units per month.
How was the property market last year? In summary, it was cold in the first half of the year and hot in the second half, so 20,000 sets a month is considered a relatively stable number
If we say that 30,000 sets have been sold, then the property market is relatively hot. If 30,000 sets of data are for three consecutive months, then the property market is even hotter.
When I saw a 3.94w set of data in the circle of friends in the market, I was a little surprised, but they also had reservations
Because of the real official data, generally you have to wait until around the 10th
Then, the real second-hand transaction data we received today, 31,540 sets
That is about 3.15w sets
After we eliminated some commercial, office and residential units that were rejected for various reasons, 31,500 units were deposited
But no matter how much, this number is already considered to be a relatively hot data in the Shanghai property market
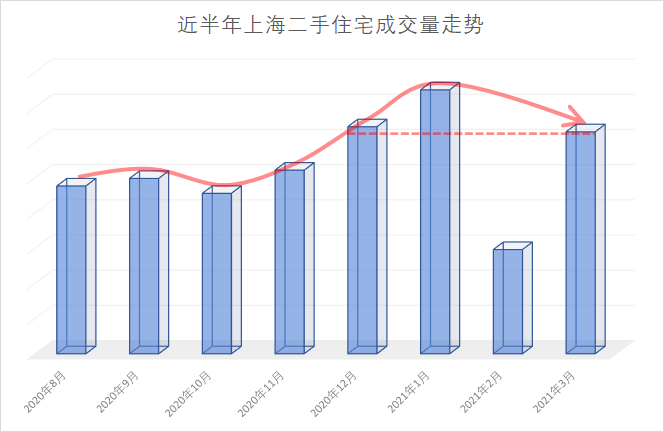
Note: February is the month of the Lunar New Year. All are greatly affected by the Spring Festival. There is no horizontal comparison with other months for the time being (the same below), source: Shanghai Lianjia
Looking back at the past six months, we put together the monthly transaction data of second-hand houses in Shanghai and compared it together. The transaction volume of 3.15w sets is still relatively high
This year’s data situation is actually easierAffected by policy
From the data, it can be seen that the entire second-hand housing transaction volume in January 2021 is broken by a day, and it is actually because of the subsequent regulatory factors that may boost the market.
So a large number of transactions were advanced before the Spring Festival to advance
Although this incident did not happen, many buyers have moved forward to March in order to complete the replacement as soon as possible
So when I look at this data, it is actually very complicated, because there are various objective factors, but it is really not a small volume
So how is the popularity of the market?
This point needs to be analyzed. It is no longer possible to simply look at the transaction.
You also need to see the recent customer source and housing situation
How many houses and customers on the 02 market
Let’s talk about the listings first. After the beginning of the year, the market listings have been increasing. Let’s take the chain home with the largest market share as an example. Its listings once increased to 3.8w units but suddenly dropped on March 20. Nearly half of the listings Currently, the listings have increased from 16,673 to 28,947. That is to say, 20 days have passed, and the number of listings has increased by about 73%
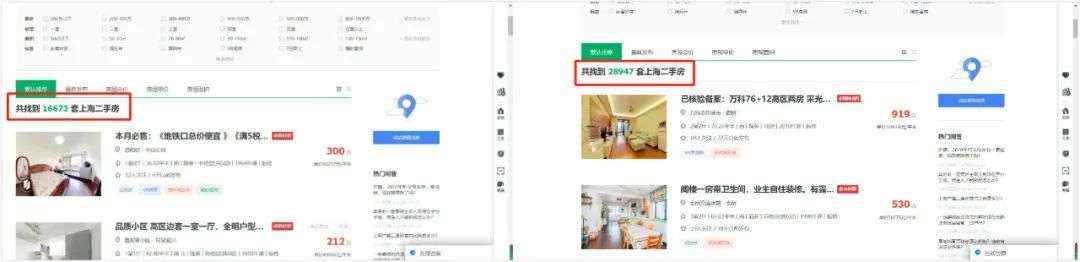
Left: March 20th, Right: April 10th
According to this growth rate, in the next month or so, Lianjia listings can basically be the same as before March 20. Return to the original state In other words, the listings are also stable. Growth
There are two factors here. The first is the policy adjustment just mentioned. Another good year for replacement in 2021. Many landlords are willing to sell their houses.
But the customer source situation is different
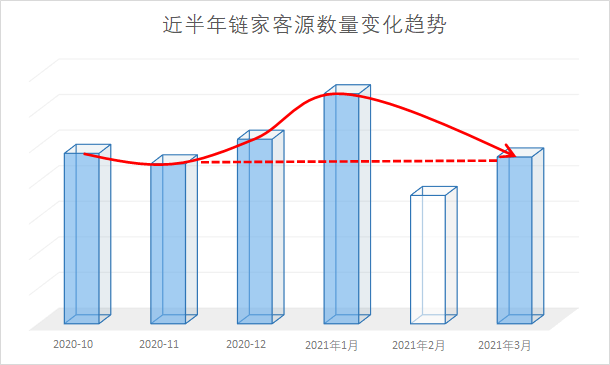
Source: Shanghai Lianjia entered March, and its customer base has declined compared with December and January.
This is the room ratio mentioned in our previous article. This time we have taken out the latest room ratio data so far
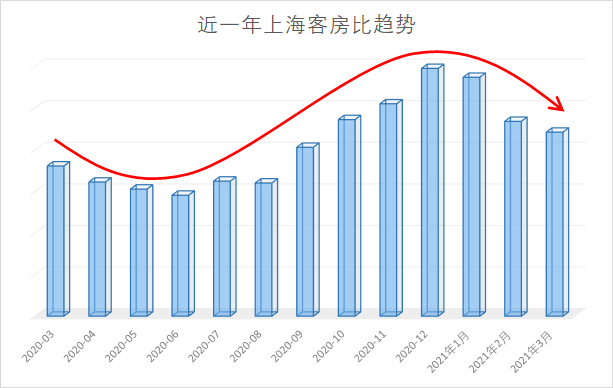
Source: Shanghai Lianjia
For example, last year’s market was that for every additional home, 3 customers would be added
That’s right now, For every additional house, about 2 customers will be added
There are also two factors here
The first is also because the housing listings are growing too fast due to policy adjustments, part of the demand in the secondary market has been absorbed, and many customers are also waiting for some of the first-hand status that is currently on the sidelines
03
Let’s take a look again
If the number of customers and the number of listings refer to the total market supply and demand, then the volume of the market indicates the degree of market activity. In the end, is there anyone who is desperately looking at the house? This directly reflects the market.True Desire to buy
Let’s look at the band-watch data of the second-hand market in recent months, we still can’t show the specific band-watch group number, but we feel the downward trend
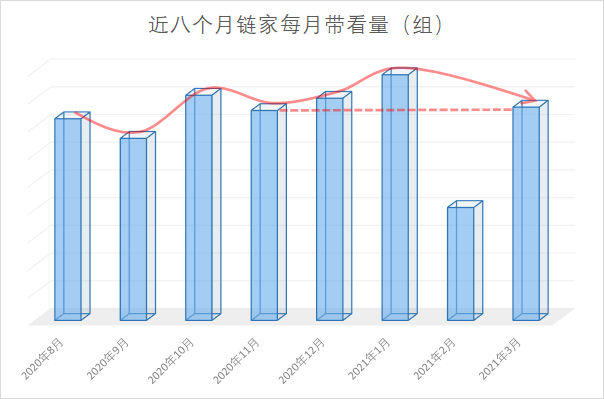
Source: Shanghai Lianjia’s number of watch groups in March has fallen back to the same level as in November last year. It can be said that the number of watched groups in March is 13% less than that of January. This is the mentality of buyers before and after the year. A true portrayal of change
It’s urgent no years ago
And in the data of this line, we also saw an interesting number that is to take a look at the transaction ratio
Simply put, it is to use the volume to see the volume ÷ volume, that is to say, for each group that the intermediary sees, 1 set can be sold
For example, if the intermediary did not take 6 groups of clients and can sell 1 set, then the ratio of the sales to see is 6
The meaning behind this number, one of the more intuitive meanings is the current market sentiment
We can see that this number reached its lowest point in December last year. On average, there will be a set of transactions every few times when we watch it. This also reflects the market sentiment at that time.
At that time, many intermediaries told me that your house can be sold in about a week after it is listed. This is the market enthusiasm.
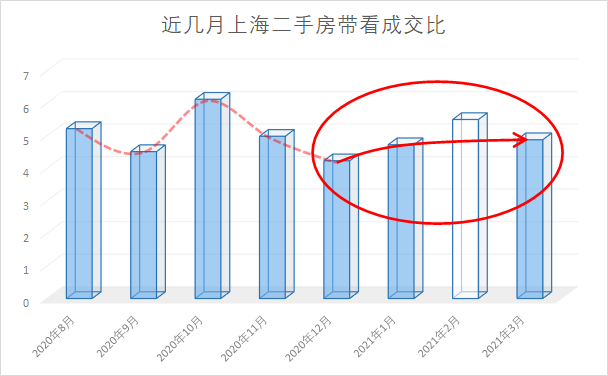
Source: Shanghai Lianjia. But in March, the market did start to become rational, at least not as exaggerated as at the end of last year
Furthermore, bargaining space
Explain to you again. As we mentioned in the article before, the bargaining space is (listed price-transaction price)/listed price. This is also in the several data dimensions mentioned today. The only data that talks about money is very Can reflect the psychological game of the landlord and client
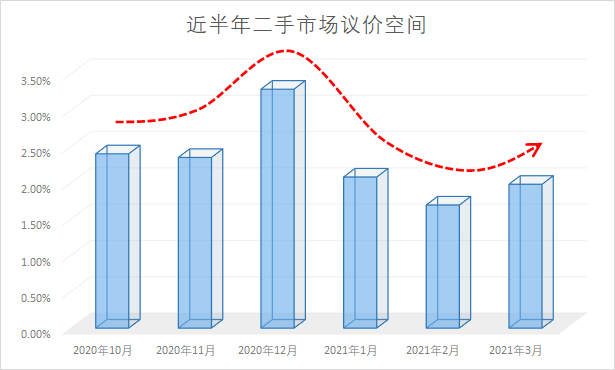
Source: Shanghai Lianjia averages in March, and the daily bargaining space is around 2.1%
This number is actually a relatively mild number
Behind the stable premium rate, there is the possibility of raising the listing price. The average bargaining rate close to 2% can only be regarded as a relatively normal level
It can only be said that the current state of the game between the landlord and the tenant is still at a stalemate. At this time, a good intermediary on your side is very important
A small advertisement is inserted here. We also have a consultation service. If you are on the way to buying a house, maybe you can find someone by yourself
04
Okay, today’s article may be very tangled for you to read, because behind every point I have but, but such a vocabulary
Why, because indeed the market is complex enough
In 2021, the Shanghai property market will have a new policy almost every month, and the impact on second-hand housing will have external interference almost every day
But I need to emphasize a few cores here
First, no matter what, 30,000 sets is not a small number. No matter what the market is, the transaction still maintains a relatively high enthusiasm. This number should not be underestimated
Secondly, the market heat should be adjusted to the state of October or November last year. You can feel that that point is exactly the turning point.
People who decide quickly will be grateful that they made a choice at that time, so for home buyers, time is important
The last point is also very important, everyone must remember
Another very important factor for second-hand use this year is first-hand interference
With the first-hand market points model, many needs are waiting for the future points of the project they are looking forward to.
An important reason why the property market can overheat is because of the first-hand influence
But after all, each first-hand project can only absorb 130% of the customer base
If in the second half of the year, if the first-hand demand cannot be released, will it enter the second-hand? This is a very important issue that needs to be addressed and faced directly
If you are determined to only consider second-hand, then my only suggestion is:
Complete the home purchase process in the first half of the year