In July 2006, before leaving Goldman Sachs for Washington, the former US Treasury Secretary Paulson deposited $ 60 billion in unrestricted government bonds in a virtual lockbox for urgent use. In the spring of 2007, the boom in the US real estate market ended, and the risks of the subprime mortgage market began to be exposed. In March, at a congressional hearing, Paulson also stated that the substandard issue has been “basically under control.” About three months later, the problem of subprime mortgages began to spread to other markets. The credit risk and financing costs of any institution holding assets that stimulated mortgages began to rise, and the balance sheet began to deteriorate. The key issue is that everything from insurance to banks to investment banks is closely related to the fate of the real estate market. This is a typical liquidity shock, the depth of the shock is the most since World War II. The $ 60 billion of Treasury bonds left by Paulson has increased the liquidity of Goldman Sachs ’assets and eased its pressure to repair its balance sheet. Its fate is therefore different from Bear Stearns and Lehman Brothers.
It has been 12 years since the 2008 financial crisis, and the US financial market has once again encountered a systemic liquidity shock. In less than a month, U.S. stocks have fallen by nearly 40%, and have experienced four meltdowns. The global financial market is filled with smoke. With experience in 2008, governments of various countries have actively carried out rescue operations and strengthened international cooperation. Although the fluctuations in the financial market have eased in the past two weeks, the impact of the new coronary pneumonia epidemic on the real economy will exert a reverse force on the financial market. Moreover, the risk of default has begun to appear. The outlook for the global economy and financial markets remains highly uncertain. This article takes the liquidity shock phenomenon in the financial market as an entry point, analyzes the formation of the positive feedback loop of liquidity shock, asset sell-off and asset price collapse from the microstructure of transactions, and then expounds the relationship between liquidity shock and economic cycle.
Definitions, measures and characteristic facts
Definitions, measures and characteristic facts
“Liquidity” is used in at least the following four contexts: monetary policy environment; balance sheet ; Financing liquidity (measures the difficulty of traders leveraging financing); the liquidity of the financial market. These four types of liquidity have a certain correlation with each other, but the positive or negative correlation and the degree of correlation have obvious time-varying characteristics. The “liquidity shock” mentioned in this article refers specifically to the liquidity shock of financial markets, and describes the degree of easing at the transaction level.
Financial market liquidity refers to the ability to trade assets at low cost, low volatility and high efficiency, so it is generally measured from the following three dimensions:
< div class = "contheight"> First, transaction costs, such as the ask-bid spread between the purchase price and the selling price, a large price difference indicates a shortage of liquidity. In addition, commissions are an integral part of transaction costs.
< div class = "contheight"> First, transaction costs, such as the ask-bid spread between the purchase price and the selling price, a large price difference indicates a shortage of liquidity. In addition, commissions are an integral part of transaction costs.
Second, the waiting time and the impact of trading on the price, the waiting time is short, the price impact is small, the liquidity is higher, and the market is deeper;
Third, the price elasticity is the time it takes for the price to return to “equilibrium” after the liquidity shock. The shorter the time, the higher the liquidity.
In general, the lower the transaction cost, the shorter the waiting time, the smaller the price impact and the greater the elasticity, the higher the liquidity.
There are many factors that affect liquidity, such as asset type, total transaction size, single transaction size, number and structure of investors, and on-site or off-site transactions, etc. . Generally speaking, the larger the total transaction size, the smaller the size of a single transaction, and the greater the number of investors, the higher the liquidity-the less waiting time and the lower the transaction cost. Of course, investors can choose different trading orders (market price or limit price) to balance trading time and transaction costs. If you do not want to wait for a long time, you need to pay a relatively high transaction cost. Overall, market liquidity measures how easy it is to find counterparties. High-liquidity assets are convenient for holders to sell at a lower cost whenever needed, so they are similar to put options.
The difference in liquidity is reflected not only between different types of assets, but also within the same type of assets. For example, financial futures, government bonds of developed countries, and major reserve currencies are very liquid financial assets. Among stocks, large-cap stocks have higher liquidity than small-cap stocks, and developed country stock markets have higher liquidity than emerging market countries; in bond markets, government bond markets have higher liquidity than corporate bonds, and investment-grade corporate bonds have more liquidity. Higher than high-yield debt; alternative investments (private equity investment, direct investment in real estate, hedge funds or physical investment in commodities, etc.) are generally less liquid than stocks and bonds.
The structure of asset return can be expressed as a risk-free return plus a risk premium, where the risk premium is mainly derived from default (or credit) risk and liquidity risk. Relative to liquidity, it is more difficult to measure the liquidity risk premium, because different types of risks cross each other and change with time and economic environment. From a qualitative point of view, assets with lower liquidity, that is, assets with higher liquidity betas, have higher liquidity risk premiums. But to quantify liquidity risk, it is necessary to avoid other differences including different types of risksBecause of the qualitative impact, in theory, the only thing that can be obtained by comparing the returns of assets with the same dimensions except liquidity is the liquidity premium. Commonly used indicators in practice, such as the spread between corporate bond yields of different maturities and national bond yields of corresponding maturities, actually measure a comprehensive risk premium that includes both credit risk premium and liquidity risk premium.
The relationship between liquidity premium and liquidity is nonlinear. Overall, the liquidity premium is negatively (positively) related to liquidity (liquidity beta), that is, the higher the liquidity (the lower the liquidity beta), the lower the liquidity premium ( Figure 1 ), But when subjected to liquidity shocks, poorly performing assets will require a higher liquidity risk premium. The rule of thumb shows that assets with higher long-term returns also suffer more in poor years ( Figure 2 ). The so-called poor year refers to the year of systematic liquidity shocks, such as the oil shock in 1974, the “Walker shock” in 1981, or the financial crisis in 2008. In the same period, the security assets represented by the national debt can obtain positive returns.

Figure 1: Liquidity and income from major assets. Data source: Ilmanen, 2011; Eastern Securities
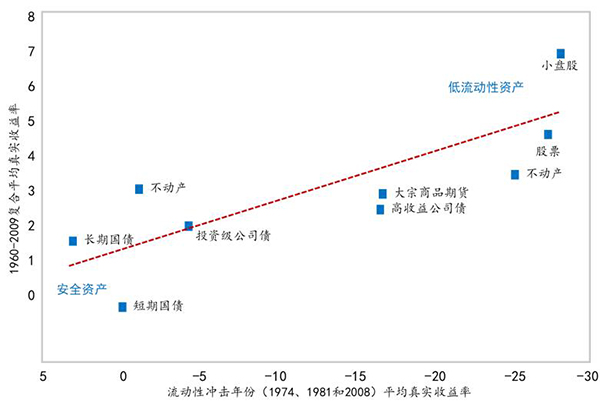
Figure 2: The true return of the long-term average and liquidity shock years of different types of assets. Data source: Ilmanen, 2011; Eastern Securities
Figure 1: Liquidity and income from major assets. Data source: Ilmanen, 2011; Eastern Securities
Figure 2: The true return of the long-term average and liquidity shock years of different types of assets. Data source: Ilmanen, 2011; Eastern Securities
On the surface, high-liquidity beta-valued assets provide a higher premium and Sharpe ratio, and therefore more investment value. For example, Pastor-Stambaugh (2003) found that stocks with high liquidity betas have an annual rate of return that is 7.5% higher than stocks with low liquidity betas. However, due to the low trading frequency of high-liquidity beta assets and the lack of high-frequency data, the Sharpe ratio of such assets or portfolios may be greatly overestimated. Because the numerator gains cover the tail risk premium, but the denominator does not include the tail risk, which is why mainstream macroeconomic models and financial pricing models are often criticized.
Since the end of the 1990s, tail risk trading strategies-short volatility, selling stock index options, spread trading, buying long and short strategies (buy high liquidity Beta stocks / short-selling low-liquidity beta stocks), quantitative hedging-beginning to be sought after by the market, they have indeed achieved considerable gains. However, as the frequency of black swan events increases, the performance of such trading strategies is more difficult to satisfy ( Figure 3, 6 ), especially after 2008, liquidity shock events are more frequent The high-liquidity beta combination underperformed the low-liquidity beta combination for a long time. The originators of the stock market crash caused by this new pneumonia epidemic and oil shocks are hedge funds. Of course, they are also the first to bear the brunt.
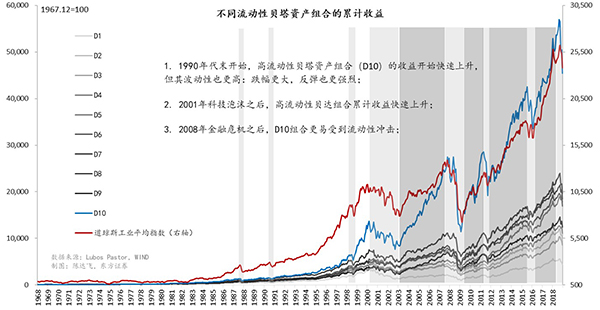
Figure 3: Rate of return of different liquidity beta combinations. Data source: Lubos Pastor personal homepage of University of Chicago professor
Liquidity shock, liquidity premium and trading behavior
Figure 3: Rate of return of different liquidity beta combinations. Data source: Lubos Pastor personal homepage of University of Chicago professor
Liquidity shock, liquidity premium and trading behavior
In addition to the fundamentals of the macro economy and micro enterprises, investors are also determined by asset prices Structure and trading behavior, as well as market structure and liquidity conditions. Fundamentals often determine the first moment of price, that is, the price center, which is the price trend in the long run. Investor is the trading behavior and the liquidity of the asset determines the second moment of price, namely the volatility. Any “black swan” event will have an impact on fundamentals, thereby affecting investmentCapitalists make buying and selling behaviors, but under different investor structures and market liquidity conditions, the magnitude of price fluctuations is different. The large swings in asset prices are more often caused by liquidity shortages and imbalances in trading structures.
In a market with a market maker system, liquidity can be expressed by the bid-ask spread of the market maker. In markets with higher liquidity, the bid-ask spread is lower. Conversely, in markets with poor liquidity, the spread is higher. This is because the basic function of the market maker is to create liquidity, and in order to create liquidity, it itself needs to bear the risk of price fluctuations. The bid-ask spread is a kind of compensation for the market maker to bear the risk. It depends on three factors: the total transaction size of the asset, the price volatility, and the comparison of the buying and selling power. Liquidity risk is inversely proportional to the total size of asset transactions, proportional to price volatility, and proportional to the asymmetry of trading power. For assets with a small total transaction size, high price volatility, and asymmetric trading power, market makers need to wait longer and bear greater price risk, so the bid-ask spread will be higher. In addition, for the same asset, as the volume of a single transaction increases, the higher the proportion of the total transaction size, the greater the bid-ask spread. All in all, to create more liquidity in a market with higher liquidity risk, the market maker will demand higher returns, and from the perspective of investors, the higher the asset value loss rate.
The price-quantity transaction structure and liquidity premium (or cost) of assets centered on market makers can be represented by Figure 4 . The red horizontal line represents the basic value of the asset, which mainly reflects the macro and corporate fundamental information; the blue curve is the market maker’s quotation. Since market makers always buy assets at a price lower than the base price and sell assets at a price higher than the base price, the upper half of the curve is the market maker ’s selling price (corresponding to the investor ’s Bid price), the lower part is the market maker’s buying price (corresponding to the investor’s selling price). The bid-ask spread is the market maker’s profit for creating liquidity, that is, the liquidity premium, and also the liquidity cost borne by investors. It will increase as the transaction size increases.
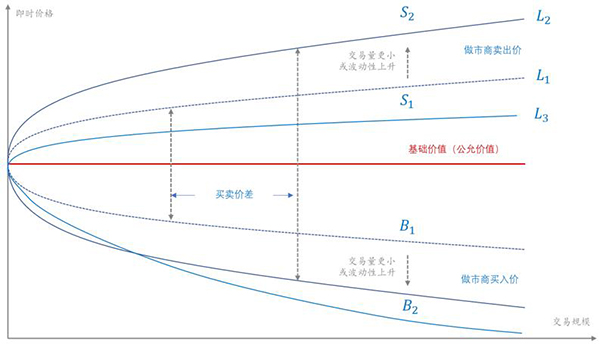
Figure4: Price-volume transaction structure and liquidity premium (or cost) of market makers. Source: Refer to George Chacko et al., 2011, drawn by the author High situation. What L1 and L2 have in common is symmetry, which reflects the equivalence of buying and selling power. The curve L3 represents a situation where the buying and selling power is asymmetric, that is, the seller’s power is greater than the buyer’s, thus forming downward pressure on asset prices. In a market where the seller ’s power is strong, the bid price of the market maker will continue to move down. Of course, the selling price will also be lowered to balance inventory risk and return, but the decrease in the selling price will be less than the decrease in the buying price , The bid-ask spread will expand accordingly.
Figure4: Price-volume transaction structure and liquidity premium (or cost) of market makers. Source: Refer to George Chacko et al., 2011, drawn by the author High situation. What L1 and L2 have in common is symmetry, which reflects the equivalence of buying and selling power. The curve L3 represents a situation where the buying and selling power is asymmetric, that is, the seller’s power is greater than the buyer’s, thus forming downward pressure on asset prices. In a market where the seller ’s power is strong, the bid price of the market maker will continue to move down. Of course, the selling price will also be lowered to balance inventory risk and return, but the decrease in the selling price will be less than the decrease in the buying price , The bid-ask spread will expand accordingly.
In summary, macro and corporate fundamental information determine the position of the underlying value of assets; liquidity affects the size of the opening and closing of the buying and selling curve, the higher the volatility, The bigger the trumpet; the strength of the trading order determines the symmetry of the buying and selling curve. When the seller’s power is greater, the overall downward pressure will be exerted. The drop in the entry price is greater, which also leads to higher liquidity premium / cost. Conversely, when the buyer’s power is greater, an upward thrust is formed, and the market maker’s selling price increases more. One rule is that the market maker’s quotation is always for the purpose of maximizing its own interests (or minimizing risk), which always means a lower buying price and a higher selling price. This trading structure and quotation model is an important dimension to understand the phenomenon of stock price surges and declines, which reflects some form of liquidity shock.
The so-called “liquidity shock” refers to a state of liquidity shortage, which is manifested by the asymmetry of the buying and selling orders and the increase in price volatility, the liquidity premium It will improve. This can refer to either the shortage caused by overbought or the shortage caused by oversold. Overbought will cause the price to skyrocket, and oversold will cause the price to plummet. In either case, the liquidity premium is relatively high. In the case of overbought, the market maker will significantly increase the selling price, and in the case of oversold, the market maker will significantly reduce the purchase price, which also means that investors can only use a higher discount rate In order to sell (or mortgage) assets. In practical applications, the liquidity shock is often defaulted to the situation of price collapse caused by oversold (such as Figure 5 ).

Figure 5: Trading structure under liquidity shock. Source: George Chacko et al, 2011, p.22, drawn by the author
Liquidity shocks and economic cycles
Figure 5: Trading structure under liquidity shock. Source: George Chacko et al, 2011, p.22, drawn by the author
Liquidity shocks and economic cycles
Liquidity shocks in financial markets often manifest as the collapse of the price of a certain financial asset, a common form of currency crisis , The stock market bubble or the real estate bubble, those sectors that are directly impacted by those financial assets that are heavy assets. Loss of asset-end value will erode its capital and increase leverage. To this end, it is necessary to compress the balance sheet-sell assets, use the funds to repay debts, or find new equity investments. In the case of asset sales, because the market value of the financial asset initially impacted may be lower than the book value, the actor may choose to sell the asset with the lowest value loss, so the price of other financial assets may also fall. Generally speaking, in the case of liquidity shortage, high-liquidity assets will be more valuable, and the liquidity premium will even become negative.
Whether the liquidity shock of financial markets will cause economic recession, the key is whether the shock is systematic and continuous, the former refers to the face of the shock, the latter is The length of the impact. Large areas and long-term liquidity shocks have a high probability of causing economic recession. On the contrary, if decisive and effective measures can be taken to limit liquidity shocks to local markets, the economic shock will be limited. Bernanke et al. (2019) likened the liquidity crisis to a “blaze” and the government’s bailout actions, mainly by the Federal Reserve and the Treasury, to a “fire extinguishing”. An analogy is made in the book to explain that the government and the fire rescue are the same. When your neighbor ’s house is on fire because of smoking in bed, the first priority is not to blame such behavior, nor to worry about whether he will commit another crime after extinguishing the fire, but to save the fire itself, because as the fire spreads, the house of innocent Will be in danger. From this perspective, it is also possible to understand why after the liquidity shocks in the US and world financial markets, Bernanke urged the Fed to take all possible measures to solve the liquidity crisis. From early March to the present, the tools used by the Fed after the bankruptcy of Lehman Brothers in September 2008 have been used.
Generally speaking, when the return of the high-liquidity beta portfolio is lower than that of theThe dynamic beta portfolio’s rate of return indicates that it has suffered a liquidity shock. Figure 6 is a time series obtained by sorting the liquidity beta from high to low, and subtracting the return of the 10% combination with the highest beta value minus the 10% combination with the smallest beta value. It can be seen that in more than 50% of the time, the return rate of the high-liquidity beta portfolio must be extremely low, and before 2008, this proportion exceeded 65%. But after 2008, the high-liquidity beta combination underperformed the low-liquidity beta combination more than 70% of the time (consistent with Figure 3 ).
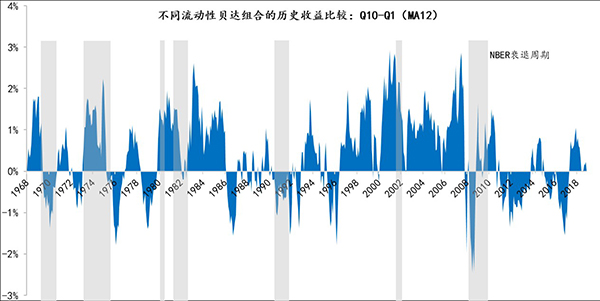
Figure 6: Liquidity shock and economic cycle. Data source: Lubos Pastor personal homepage of University of Chicago professor, NBER, Eastern Securities
Figure 6: Liquidity shock and economic cycle. Data source: Lubos Pastor personal homepage of University of Chicago professor, NBER, Eastern Securities
From 1968 to 2018, there are more than 10 systems in 50 years Sexual liquidity shocks, about half of which are related to the economic recession. Conversely, in most cases, the economic crisis is related to the liquidity shock, that is, the economic crisis mostly starts from the liquidity shock. Generally speaking, if the liquidity shock directly affects the banking sector, then there is a high probability of economic recession. Because the liquidity crisis will evolve into a credit crisis, and the contraction of credit will directly lead to the stagnation of production and consumption activities.
In response to the impact of the new coronary pneumonia epidemic on financial markets, governments around the world have launched corresponding firefighting operations, hoping to control the fire on “Wall Street” and prevent its spread To “Main Street”. In terms of effectiveness, liquidity alerts in some markets have been temporarily lifted, the panic index (VIX) has declined, credit spreads have narrowed, and the liquidity shortage in the US dollar has eased, but at the same time, many industries in the United States The implied credit default rate has exceeded that of the 2008 financial crisis, and the direct impact of the epidemic on the real economy will also significantly exceed that of 2008. In the past two weeks, the number of Americans receiving initial relief has exceeded 10 million, and the unemployment rate in March is expected to Two digits. At present, the spread of the epidemic in the United States is still accelerating. If the economic shutdown is maintained for 1-2 months, then the liquidity shock will continue to hit, and it will also superimposeCredit default and corporate bankruptcy. In a pessimistic situation, the global economy may face a more severe recession than in 2008.
(Author Shao Yu is the chief economist of Oriental Securities, Chen Dafei is a senior macro analyst of Oriental Securities)