Overall equivalence.
Unfortunately, its prediction of the flu trend in the United States is much higher than the results announced by the US CDC (US Centers for Disease Control and Prevention).
Many people don’t understand, what’s wrong with the setting that the big flu search data must include all flu data?
From a statistical point of view, this method of predicting the incidence of influenza based on search keywords only satisfies the relevance of the data, but lacks an important link-the investigation of the causality between the data. In other words, lack of control over the prior distribution of sample background.
What is the prior distribution?
A simple understanding can be done like this: Before conducting a survey, the researcher needs to make basic settings for the sample attributes involved in the research itself, and conduct sampling on this basis.
For example, if we want to predict the possible sales of a new product in the future, according to the statistical method, we should first design the population that this research should cover based on the attributes of the product and other basic elements, and then make the relevant Sampling survey and data analysis. Instead of taking the opposite path-first find the existing data, and then filter according to needs.
The Bayesian school of statistics believes that in any statistical inference problem, a prior distribution must be specified for the survey population, which is an indispensable element when making inferences.
The lack of knowledge of the prior distribution of data can easily lead to deviations from the actual situation in the forecast analysis, and many cases have proven that this deviation will truly reflect the results of the investigation.
This is a problem that no amount of data can solve, and there is no way to really solve the overall system error through optimization algorithms.
2
Invisible “Overall”
——Is mass data the overall?
The above example tells us that there is a broader and more fundamental concept than mass data, that is-“total”.
In statistics, the population refers to all the objects to be studied. It is a collection of all the objects to be investigated, which are specified according to a certain research purpose. The advancement of technology has created massive amounts of data, which can easily create an illusion that massive amounts of data can represent the overall.
If big data is trees, then the whole is the forest behind it.
In order to avoid the dilemma of “seeing the trees but not the forest”, it is necessary to effectively solve the overall problem of the research before the research starts.
Statistics tells us that in a research in a specific field, we cannotThe known data obtained by any single channel is equivalent to the complex “population” itself that contains a rich prior distribution. Regardless of the magnitude of this data, even the super application ecosystem of Internet giants covering one billion users.
So, how to construct a scientific and reliable “population”, and conduct sampling design and related investigations and inferences based on this population pool, and dig out consumers’ potential behavior characteristics and unknown behavior patterns, so as to provide enterprises with market decision support It makes a lot of sense.
In the big data environment, telecom operators, large platforms, and research companies’ own online sample groups each have a huge amount of user resources. Under such a situation, how can we scientifically integrate these data to more effectively cover the “total” we hope to achieve?
3
Build a scientific overall
——Is data fusion possible?
Nowadays, there is a lot of discussion about data fusion in the market research industry. The approach of CTR is to solve the different problems of each company by constructing a company’s own big data sampling frame, and never in a certain one. Seek answers to all questions in a specific data set.
The so-called big data sampling frame refers to the overall structure of netizens (CNNIC China Internet Development Bulletin) as the frame of reference, while integrating multi-channel data to independently construct a scientific target population.
This approach can effectively increase the coverage of the target population and accurately reflect the characteristics of the target population. The resulting data will also have higher sample representativeness and accuracy of statistical inference.
So, is the fusion research data reliable?
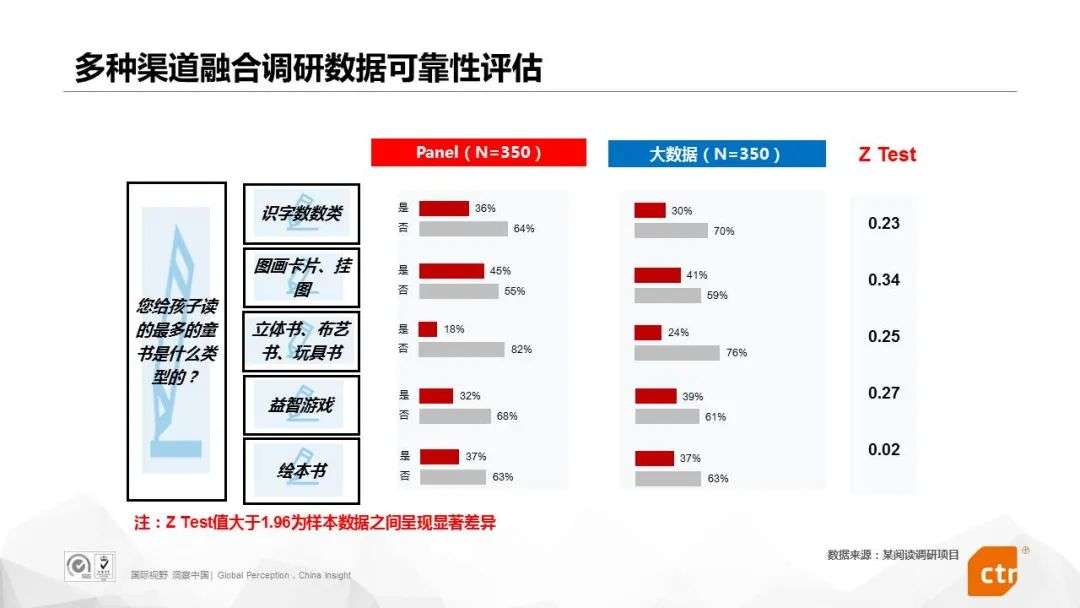
Generally speaking, we can use large-sample randomized controlled research methods to scientifically evaluate the reliability of survey data.
To put it simply, the two sets of samples, the test sample and the control sample, are randomly selected from the original samples of each channel to eliminate system errors and bias as much as possible, and then statistical methods are used to test the significance of the two sets of data.
If the conclusion shows that there is no significant difference between the two sets of data, it can prove the reliability of the fusion survey data. Of course, research companies will also use historical data accumulated in the past and market experience data to conduct comparative studies to analyze and evaluate the quality of survey data.
The following figure uses the fusion research data of a reading research project using two channels of big data and its own online sample group as an example to do a comparative analysis:
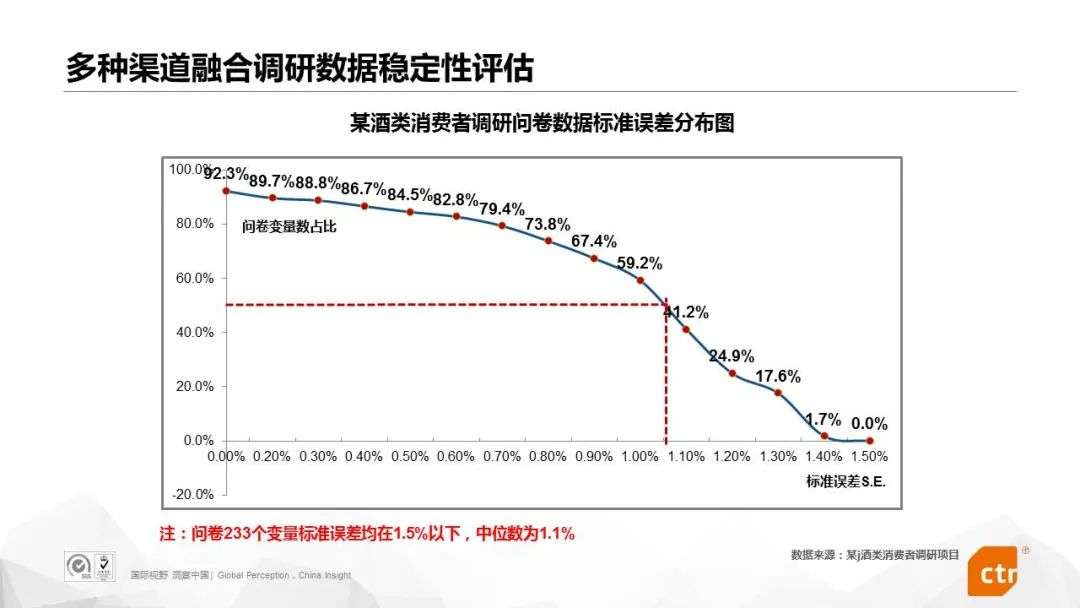
Of course, in addition to reliability, stability is also a very important evaluation index for survey data quality. We can divide the data into different percentage intervals to examine the stability indicators: if the error ratios of the survey data are not much different in each percentage interval, it means that the stability of the data is guaranteed.
Take a wine consumer research project implemented by CTR as an example. Through the big data sampling frame, the project integrates a total of 1215 samples from various channels. The standard error of the average of the 233 variables in the questionnaire is below 1.5%. The median is 1.1%. It can be seen that the stability of this fusion survey data is very high.
It can be seen that the big data sampling frame method can indeed effectively solve the problem of scientific coverage of the overall survey in the big data environment.
4
Summary
——”good” data is better than “big” data
Everyone dealing with data should keep in mind: Big data is never the same as full data. This means that big data analysis must be based on scientific research methods and cannot be overridden at will.
“Good” data is better than “big” data. When we collect and use data properly, the value of data is often surprising. Conversely, the more data collected through incorrect methods, the high-cost conclusions may mislead customers and mislead consumers, causing them to form wrong perceptions and make wrong decisions.