Last week, the volume and price of second-hand housing in the Beijing area fell, with Langfang and Shijiazhuang falling the most, with transaction volume falling by more than 10%.
Editor’s note: This article comes from WeChat public account: Receiving observation, (ID: xiaoershuyouhui) a>, author: blank, white, authorized reprint
Empty and white market
City around Beijing
Core perspective
• Last week, the volume and price of second-hand housing in the Beijing area fell, Langfang and Shijiazhuang fell the most, and the transaction volume fell by more than 10% from the previous month;
• Among them, the transaction volume and price of second-hand housing in Beijing all fell slightly, making the transaction more difficult;
• In the face of a sluggish market, Tianjin owners tend to sell at lower prices. Last week, the number of new listings increased by more than 10%, and the average listing price was significantly lowered.
• Langfang’s second-hand housing transaction volume is small and has fallen for 4 consecutive weeks, with strong buyer power and further strengthening
Volume
From the data point of view, Beijing has the highest transaction volume at 1419 units; the market volume of Langfang, Beijing, Tianjin, and Shijiazhuang has all declined to some extent.
Figure: Trend of Total Sets (Sets)
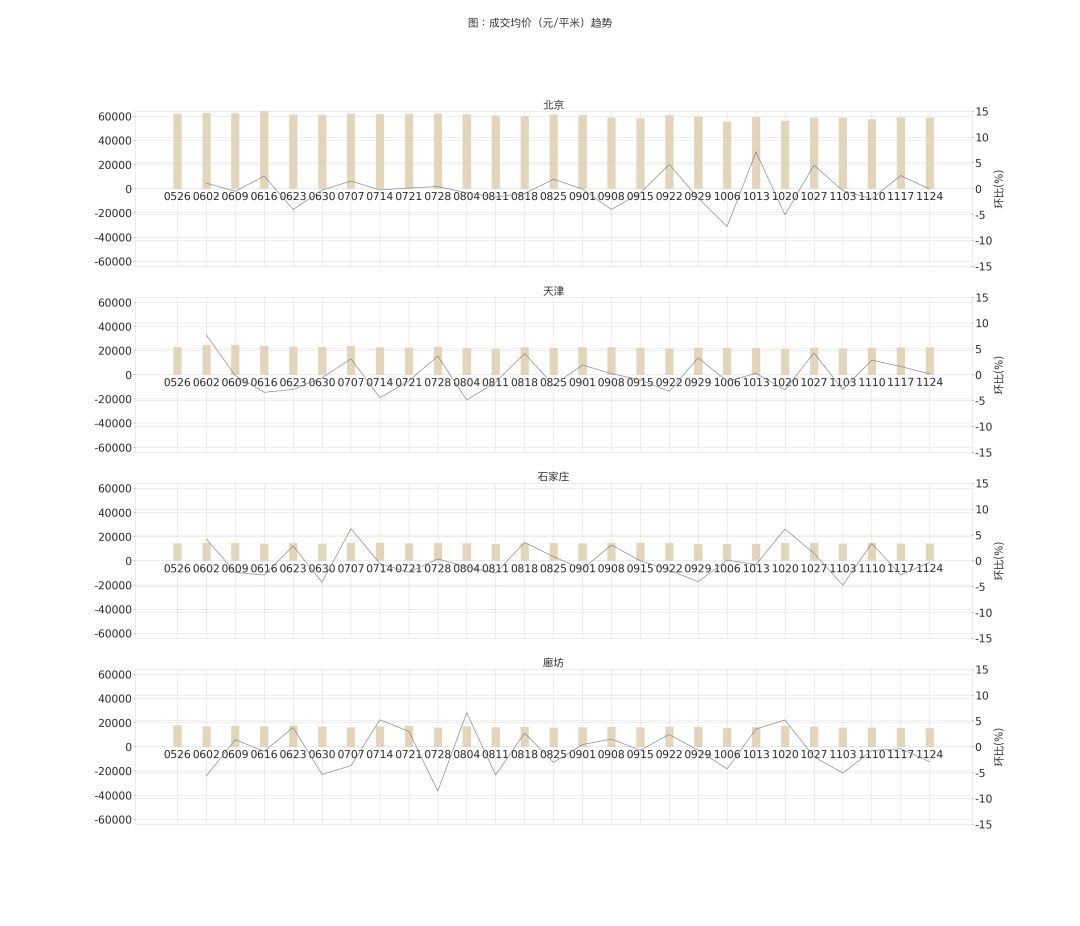
Average price
From the transaction price point of view, Beijing is the city with the highest average transaction price in the surrounding Beijing cities. Last week, the average transaction price reached 59,129 yuan / square meter, which was a change of -0.1% from the previous month. The average transaction price in Tianjin rose 0.17% month-on-month, the largest increase.
Figure: Trend of average transaction price (yuan / square meter)
City around Shanghai
Core perspective
• From the transaction data, last week, the volumes of the Central and Soviet Union and Hangzhou in the Shanghai-Shanghai Circle rose and prices fell, and Shanghai’s transaction volume fell significantly;
• Among them, Hangzhou’s transaction volume rose 27% month-on-month, but the average transaction price fell, and the ownersWillingness to enter the market is not strong;
• The transaction volume in Suzhou has also increased, but the wait-and-see mood of both buyers and sellers has increased;
• Shanghai’s transaction volume has dropped significantly, and buyers are waiting to see the mood;
• The Nanjing second-hand housing market is relatively stable, but the wait-and-see mood of buyers is increasing
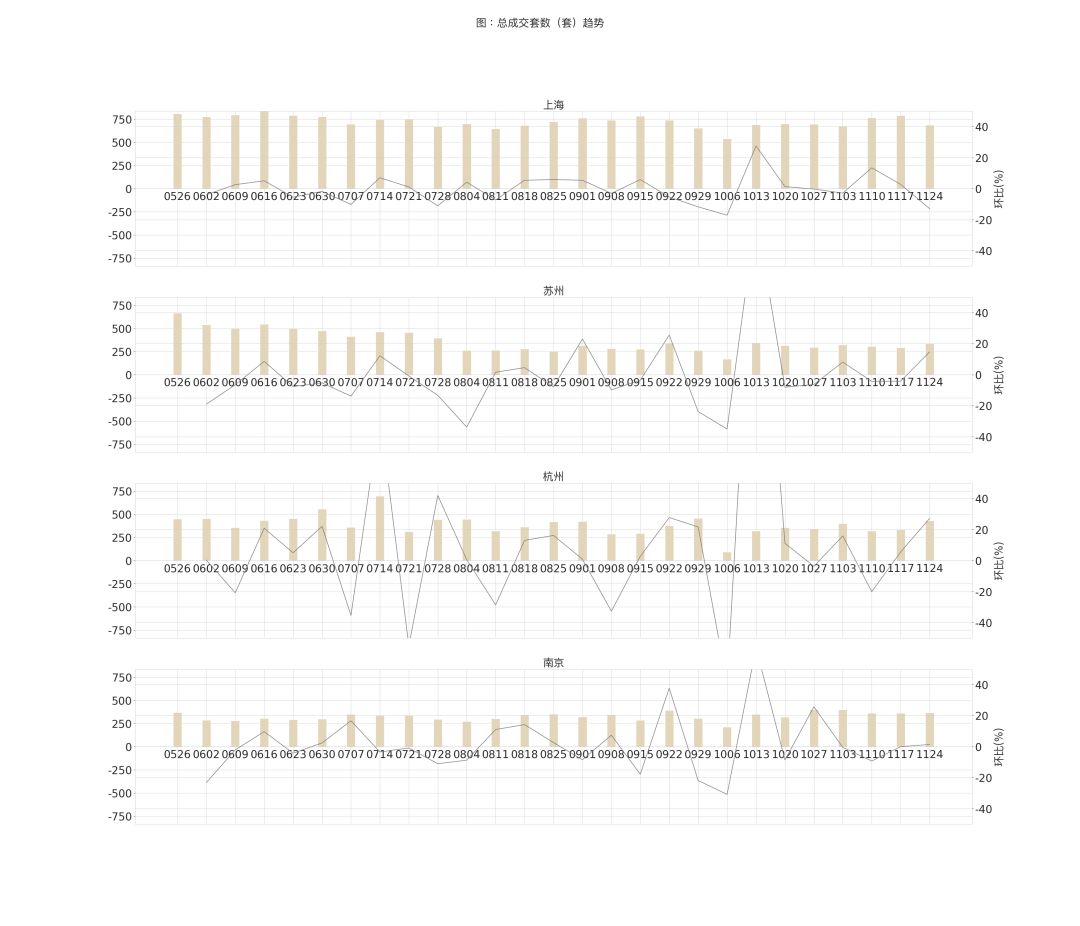
Volume
From the data point of view, Shanghai has the highest trading volume at 687 units. In addition, Hangzhou’s trading volume has increased by 27.22% month-on-month, while the Shanghai market has seen a certain month-on-month decline.
Figure: Trend of Total Sets (Sets)
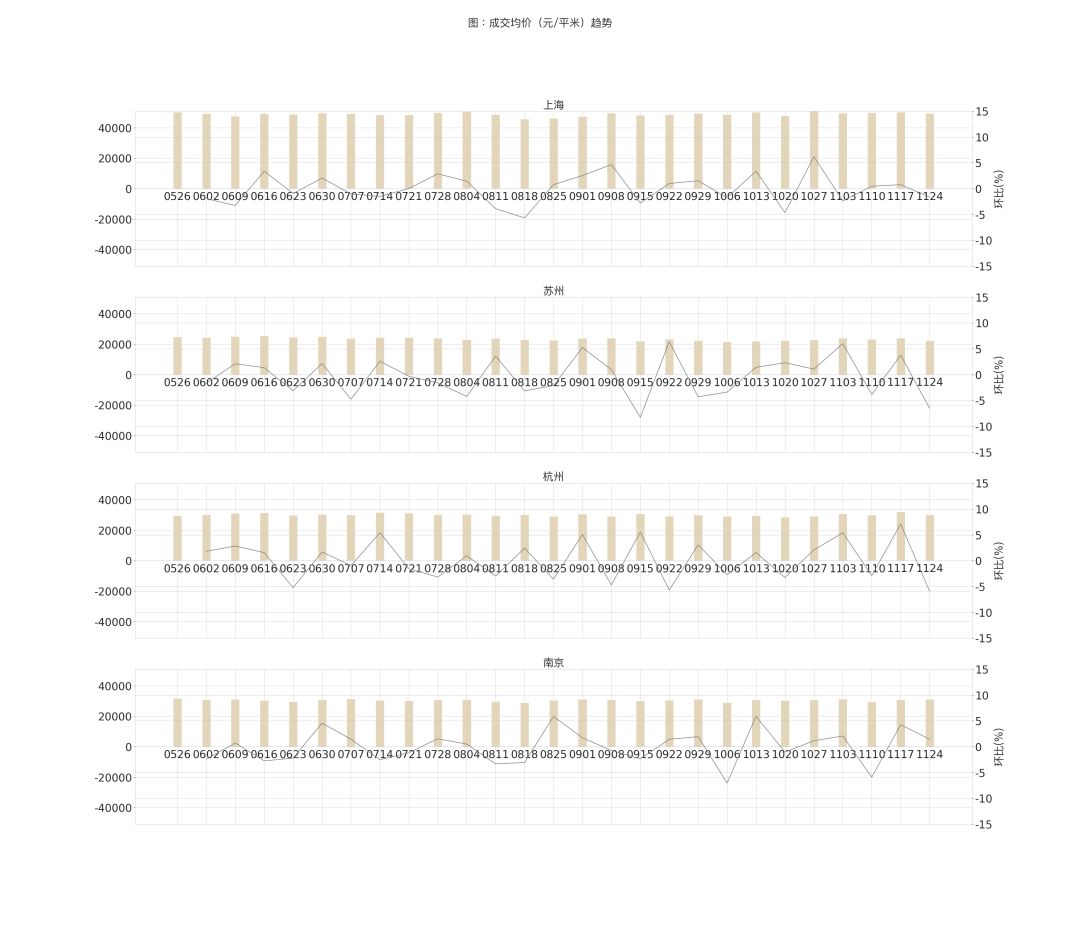
Average price
From the transaction price point of view, Shanghai is the city with the highest average transaction price in the surrounding Shanghai cities. Last week, the average transaction price reached 49,519 yuan per square meter, a month-on-month change of -1.63%. The average transaction price in Nanjing rose 1.44% MoM, the largest increase.
Figure: Trend of average transaction price (yuan / square meter)
Cities in the Greater Bay Area
Core perspective
• The policy benefits are gradually digested, the market returns to rationality, and the enthusiasm for buying houses in the Greater Bay Area has decreased;
• After the replacement demand released by the adjustment of the luxury house line was digested, the volume and price of second-hand housing in Shenzhen fell, and the wait-and-see mood of buyers increased;
• The number of second-hand houses in Huizhou has risen steadily, but the transaction cycle at the purchase end has prolonged significantly, up 70.18% from the previous month;
• The number of second-hand houses in Dongguan has risen steadily. Although the owners’ willingness to enter the market has not diminished, the wait-and-see mood of buyers has increased significantly.
• Xiamen second-hand housing market volume and price go up, transaction cycle is significantly shortened;
Volume
From the data point of view, Shenzhen’s trading volume is the highest at 721 units. In addition, Huizhou’s trading volume has increased by 10.37% month-on-month, while Dongguan and Shenzhen market’s trading volume has fallen to a certain extent.
Figure: Trend of Total Sets (Sets)
Other key cities
Core perspective
• Changsha has been attracting much attention because of its price depression. Changsha second-hand housing prices have fallen for two consecutive weeks, and the transaction cycle has been significantly extended.
• Qingdao second-hand housing prices rose, prices fell, owners are not willing to enter the market
• The transaction volume of second-hand housing in Dalian and Shenyang has fallen and prices have risen, the house purchase cycle has been significantly shortened, and owners have a strong willingness to enter the market.
Volume
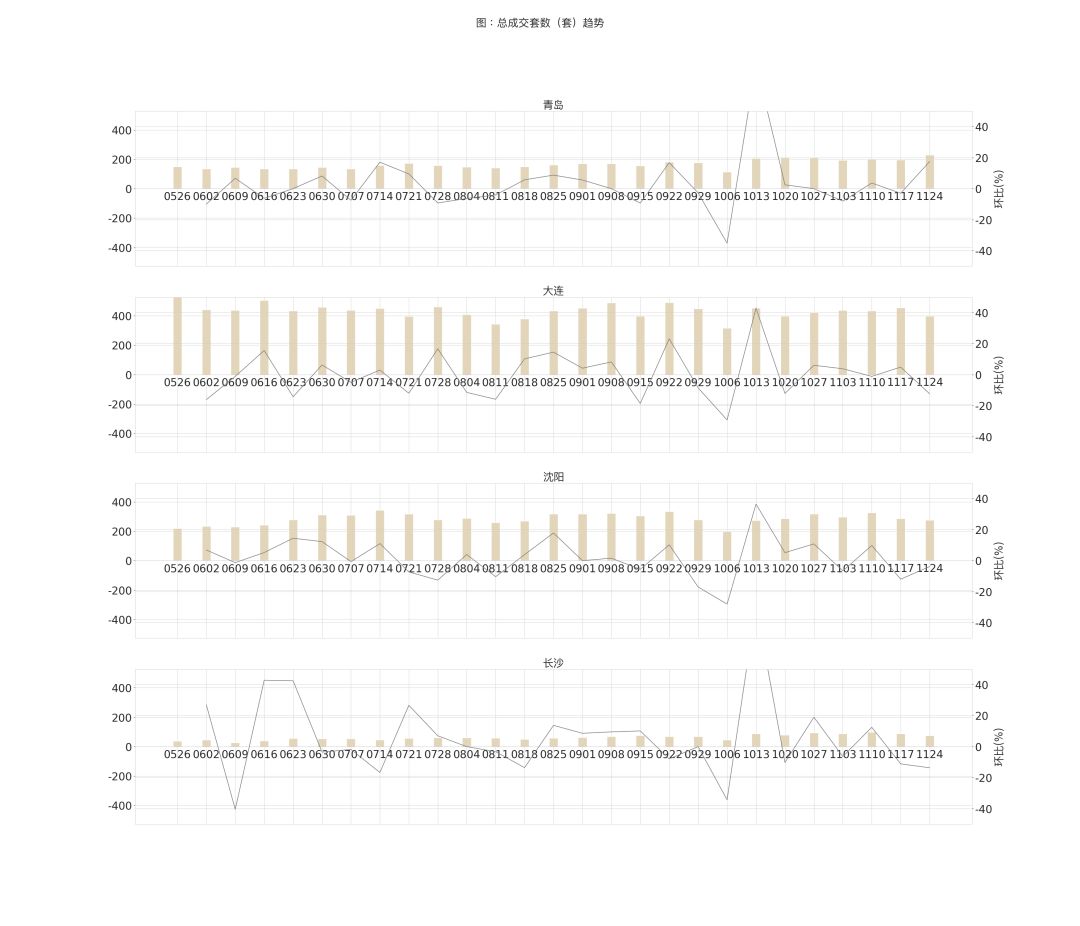
From the data point of view, Dalian has the highest trading volume at 398 units. In addition, Qingdao’s trading volume increased by 17.44% month-on-month, while Dalian, Changsha, and Shenyang markets saw a certain month-on-month decline.
Figure: Trend of Total Sets (Sets)
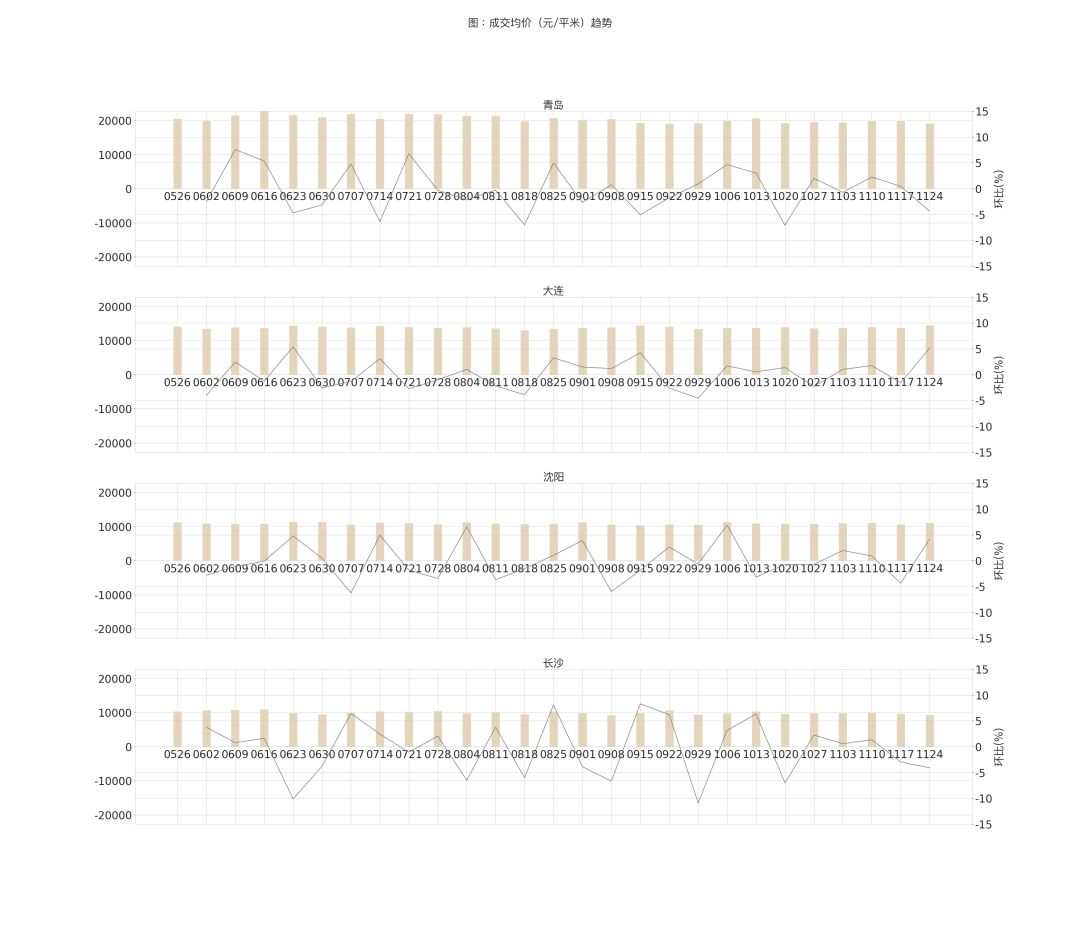
Average price
In terms of transaction prices, Qingdao is the city with the highest average transaction price among other key cities. Last week, the average transaction price reached 19164 yuan / square meter, which was a -4.35% month-on-month change. The average transaction price in Dalian rose 5.13% month-on-month, the largest increase.
Figure: Trend of average transaction price (yuan / square meter)