Look at user experience design from three perspectives: the North Star indicator of user growth, team goals, and personal key achievements. pd / 3283210.html “target =” _ blank “>” everyone is a product manager “(public No. ID: woshipm) , author: UE calves, original title:” from a growth perspective, see user experience design “.

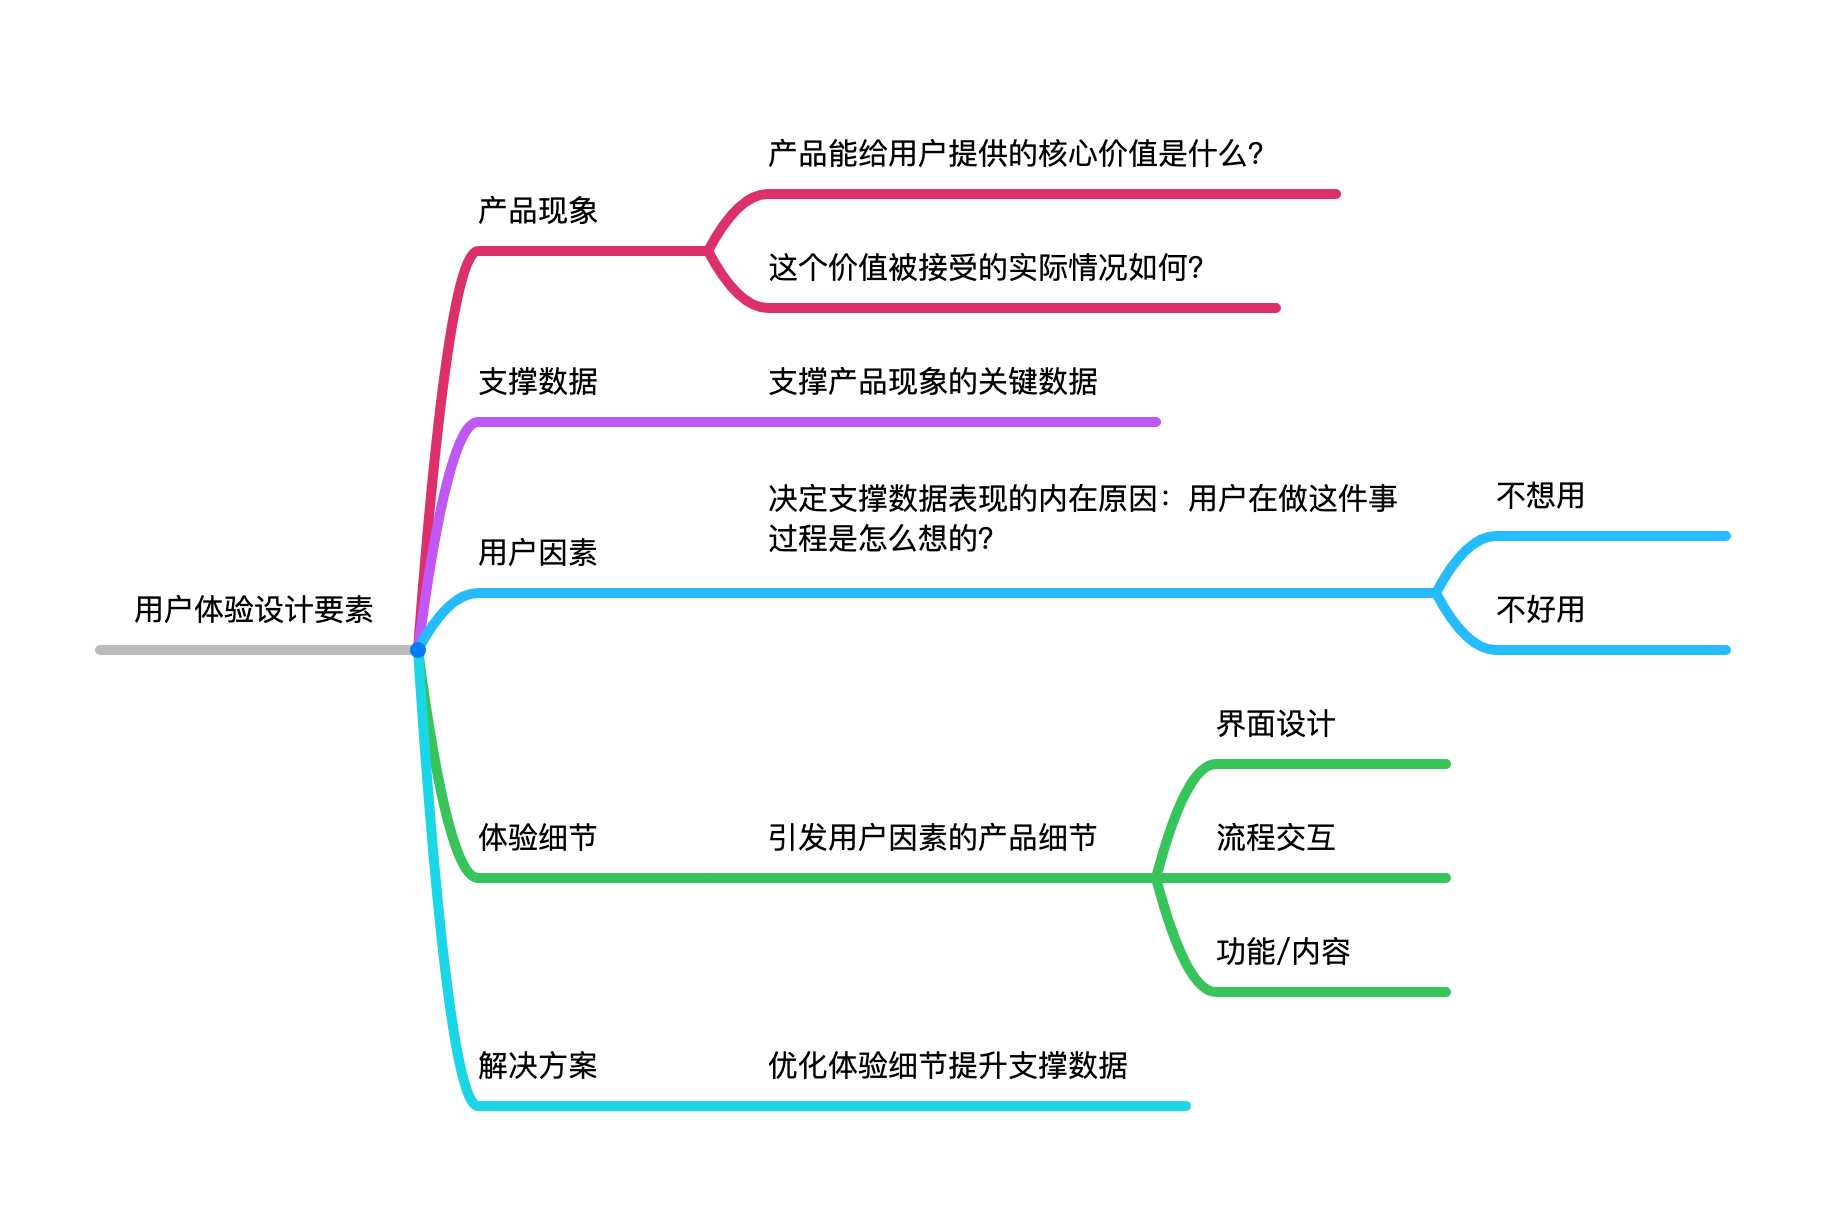
Five elements of user experience design
Product Phenomenon
Understanding the phenomenon of a product requires two pieces of information:
1) What is the core value that the product can provide to users?
For example, the core value of Pinduoduo is “cheap, save money”; the core value of Hema is “fresh, affordable, and convenient”; the core value of Snowball is for unstructured reviews related to stocks; The core value is the interpretation of the highlights of the stock characteristics.
How do you find such value? If it ’s your own product, you can take the initiative to ask your superiors; if it ’s a competing product, you can ask yourself what makes me use this product every time. I ’ve recently become obsessed with Tencent ’s mobile game “Naruto ol”. I play it almost twice a day, the main reason is that I want to collect powerful ninjas and match my own Naruto team to experience the Naruto world.
2) How is this value actually accepted?
After knowing the core value of your product, you need to know whether this core value will work or not. For the Snowball APP, for example, we can use retention data to show that the next-day retention rate or weekly retention rate is higher than the average industry level, indicating that the core value of unstructured reviews related to stocks is accepted by users.
Support data
Support data is the key data that supports product phenomena. The successful product phenomenon is likened to a beautiful building, and the supporting data is the foundation under this building. It supports the building, and once something goes wrong, the building no longer exists. Around the product phenomenon, each team will separate their own goals, such as the snowball APP wants a retention rate higher than the industry average, in order to reflect the high loyalty of snowball users,The goal of the content operation team is to increase the content click-through rate; the goal of the content production team is to increase the quantity of high-quality content production.
User factors
The internal factor that determines the performance of the data is the user factor, that is, what the user thinks and encounters when doing this.
Experience details
Find out the product details that cause user factors. For example, through research, it is found that the content of the Snowball APP is very dense. The single content has no effective content except the title and summary, resulting in no clicked points of interest.
Solutions
Improve support data by optimizing product details, such as optimizing the presentation of Snowball APP content to increase the click-through rate of recommended content. This idea is very important. We are constantly optimizing the details to achieve product success instead of making big moves, and redesigning a multi-disruptive product concept, which is too utopian.
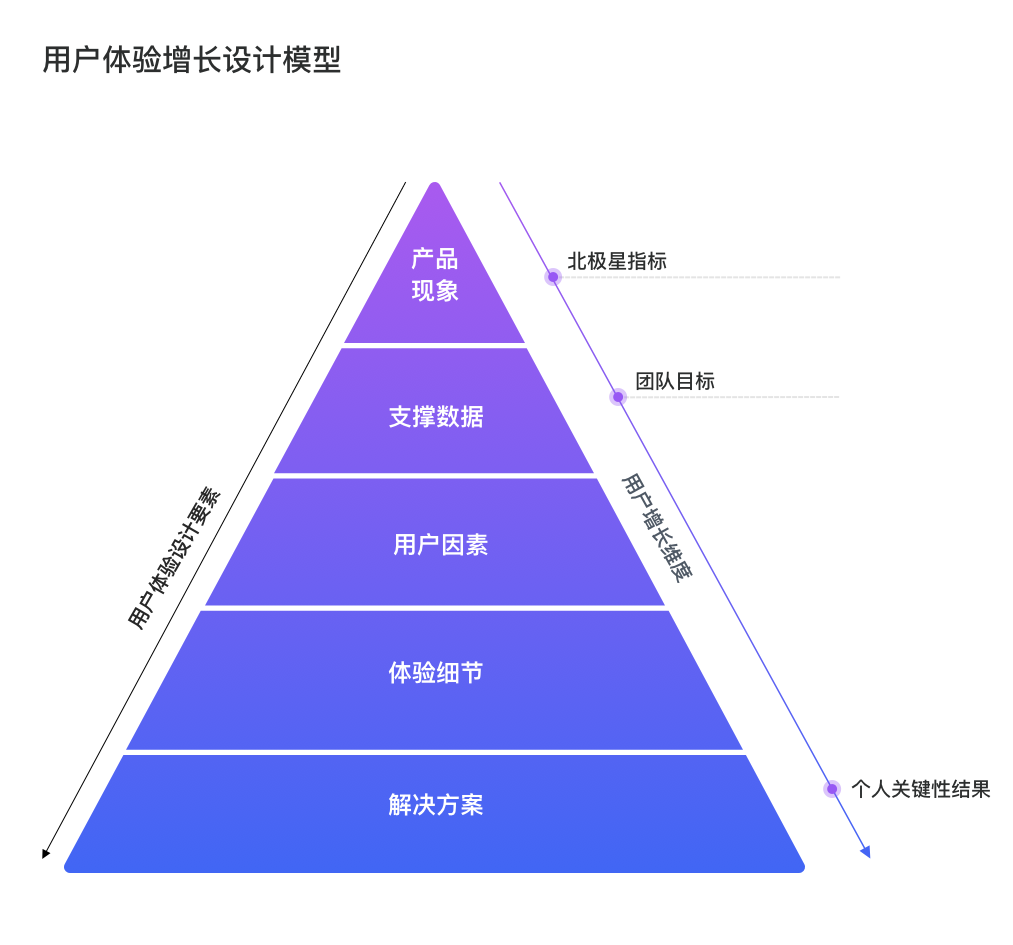
3 dimensions of user growth
North Star Indicator
The North Star indicator is a common goal for the entire department or company, and is all on the north side. The purpose of setting the North Star indicator is to ensure that hundreds of thousands of people are working in one place, not aimlessly. According to the stage of the product, the Polaris indicator can be divided into three types: the growth indicator in the early stage of the product, the active indicator in the intermediate stage of the product, and the monetization indicator in the stable stage of the product.
Team goals
The characteristics of the North Star indicator are very high, so the direction guidance is particularly good, and everyone can see it, but because it is too high, it is difficult to land directly, and it needs to be disassembled into team goals that can be landed one by one. For example, the North Star indicator is that the weekly retention rate of a certain product reaches 70%. How to achieve it? Is it impossible to start? But if I tell you, you need to ensure that the number of high-quality capacity production in this week exceeds 1,000. Can you think of what you can do? This is the dismantled team goal, which can be implemented and implemented.
Personal key achievements
Aiming at the team goals, each member can position his own role, find out what he is good at, and produce personal key results. For example, the operating staff can do an operating topic every week, and this topic can be no less than a week. 300 premium content.
User experience growth design model: from experience design to user growth dimension
From product phenomenon to North Star indicator
The North Star indicator in the user growth dimension is actually a key indicator to quantify the acceptance of core values in the product phenomenon. For example, the core value of the Snowball APP mentioned above is for stock-related unstructured reviews, so quantifying such content The key indicator of whether it will become a memory point for users to use this product is the retention rate, so the retention rate is the North Star indicator of the Snowball APP.
From supporting data to team goals
The supporting data in the user experience design element is actually about the disassembly of the North Star indicator, and the high-level North Star indicator is disassembled into individual, executable team goals.
From solution to personal key results
The output of each solution corresponds to a key outcome related to the team’s goals, while the input corresponds to insights into user factors and experience details.
Thinking
I do n’t know if I understand you. If you understand, you can disassemble the project case you are currently working on to the user experience growth design model in the picture and see if there are any new discoveries!
Author introduction:
UE Calf, WeChat public account: interactive experimental lion, everyone is a product manager columnist. Focus on product thinking, user experience analysis, interaction research, and devote to the exploration and practice of UX methodology.