Studying the traffic of Slack’s website is enough to judge the key indicators of its business.
Editor’s note: This article comes from the WeChat public account “ Growth Box Black Box ” (ID : Growthbox2), author yolo.
Hello everyone, I’m yolo, a growth engineer, and a partner in the growth black box. I have been studying the growth laws of companies for a long time, including how to use data to interpret the company’s growth status and market trends. In the past, we have also tried the research of the secondary market, trying to explore the changes in the stock prices of listed companies through public data.
Seeing the recent global economic turmoil, everyone is more interested in financial markets. So today I will share with you how we study the data of US stock Internet companies and make money from the stock market.
Please note that the research methods introduced below have certain limitations. It is not possible to establish a rigorous valuation model to predict stock prices, but only to judge the company’s development trend as a valuation Reference dimension. This case is not to study with you how to stock market, but to provide a reference for research ideas and introduce the application value of public data.
We used to focus on the primary market. And the leap to the secondary market is actually a very accidental thing. In 2019, in order to help our customers to do projects, we specially spent more than 100,000 yuan and purchased a set of tools called SimilarWeb: it can monitor the traffic data of global websites and apps in real time, such as Daily activity, traffic sources, ad volume, etc. 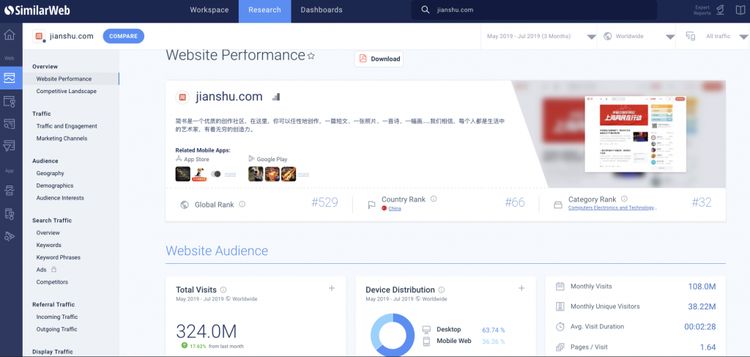
I spent such a large sum of money, I Naturally every day thinking about how to earn back-just use it when doing a project, obviously it is not fast enough. Later, I suddenly realized that the fastest place to make money with data must be the secondary market! Why don’t we use these traffic data to predict the performance of listed companies and buy stocks?
In general, a company’s business indicators (such as revenue, user volume, customer acquisition cost, user growth rate, etc.) can reflect the company’s operating conditions, soIndirectly affect stock prices. However, these key figures are not always available to you. They are usually only published in the company’s financial report once a quarter, and are released in the previous quarter (delayed by 3 months). As the information is highly opaque, the company’s stock price will fluctuate sharply every time the financial report is disclosed.
If we can predict the changes in the company’s operating indicators on (or outside of) financial reports based on public data, we can use this information asymmetry, short or long in advance, and earn after the stock price fluctuates Spread-It’s easier for internet companies to get this data.
Just do it. Because SimilarWeb’s data for overseas markets is more accurate, we set our sights on the US stock market. It happened that a major event happened in the US Internet industry at that time: Slack went public .
This collaborative office software, which is very similar to Dingding, Feishu, and WeChat, has long been hailed as “the growth myth of the SaaS industry.” Opening skyrocketed 48%, and the market value once exceeded 23 billion U.S. dollars – and it took only five years from product launch to market. Today, Slack has 10 million DAUs, and more than 600,000 organizations use Slack, and 77 of the world’s top 100 companies are its users.
It immediately caught our attention, so I decided to check its data with SimilarWeb to determine if I should buy a batch of Slack stock.
First, we realized that, unlike most to C products that direct downloads, Slack is a to B SaaS tool, and its website is the first place for new users. For new users, whether they are actively applying for registration or passively accepting the invitation of colleagues, they must go through the website to complete the registration and start using and downloading the client. The website carries the most critical behavioral data of Slack users-registration, downloading, paying, joining a business, active use, etc., all of which can be tracked and quantified with website traffic data.
So researching the traffic of Slack website is enough to judge the key indicators of its business. Our research found the following key conclusions:
1 . Official website traffic has not improved
Slack website trafficThere has been no significant improvement since 2018 . A company that is growing so fast has extremely flat website traffic. A lot of advertisements and branding will lead traffic to the official website, which is a bit counterintuitive. 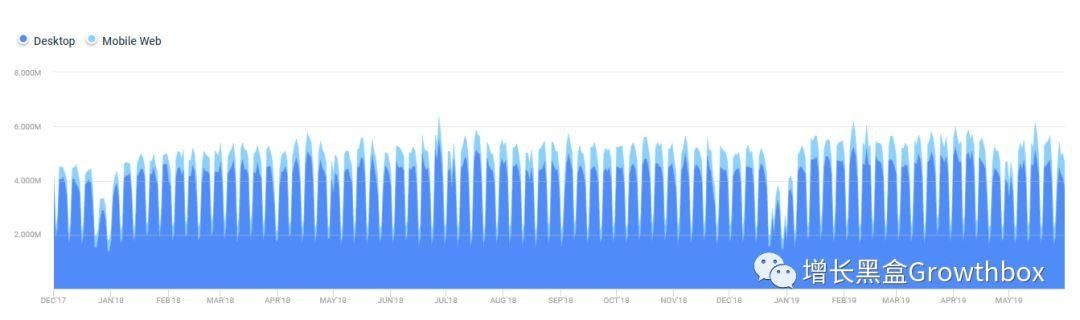
2. < / em> Growth of key page traffic slows down The data shows that the proportion of traffic on key pages of the website has not increased significantly for a period of time, or even slightly decreased:
-
The start page after entering your email is slack.com/get-started,
-
Page slack.com/create when creating an organization,
-
The download address of the Windows client is slack.com/downloads/windows,
-
and select your own organization page slack.com/your-workspaces,
The proportion of traffic has decreased to some extent. This means that the proportion of users who visit Slack to register, create a business, and download clients is declining, which may reflect the lack of momentum for new user growth. 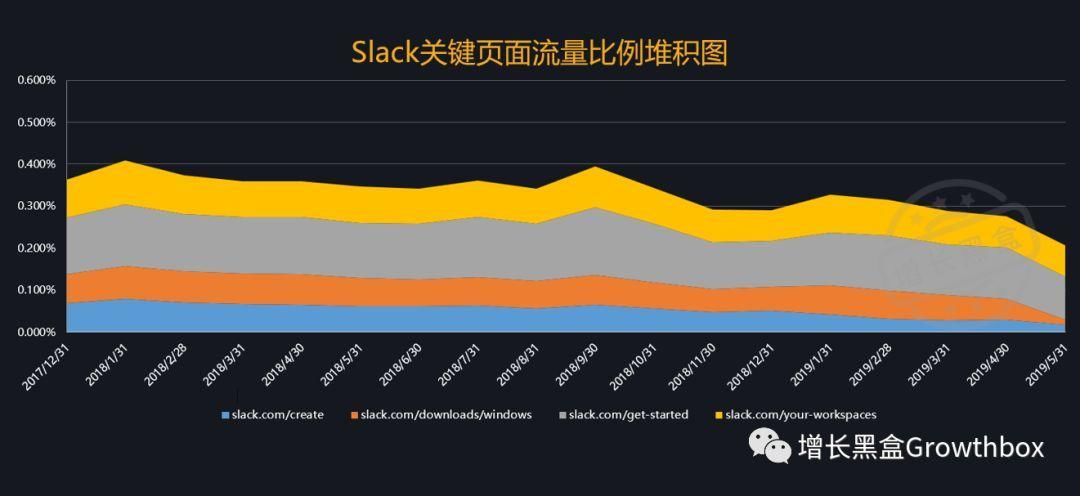
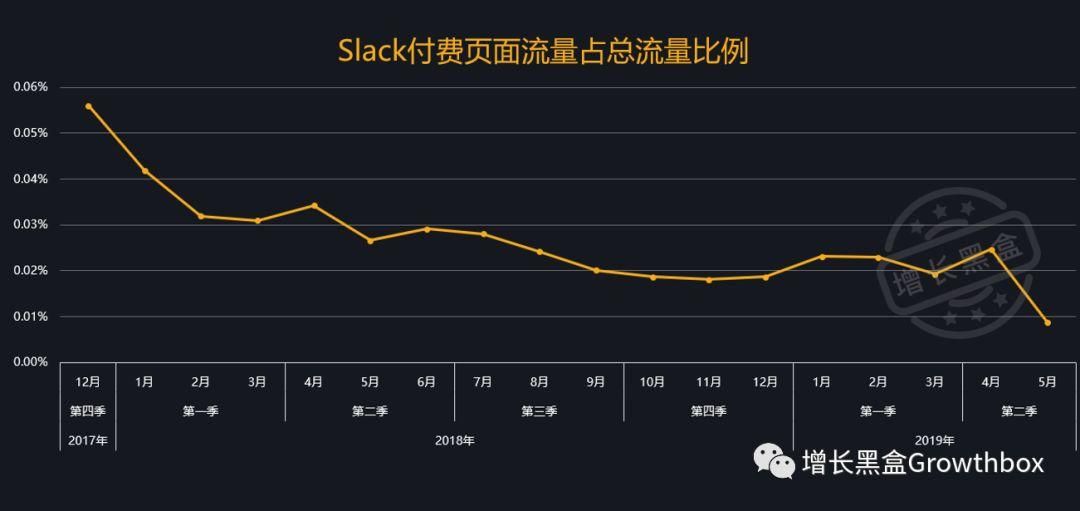
3. The proportion of paying users has dropped
Slack’s model of making money is very simple. You can sign up for free, but some advanced features must be upgraded for a fee. Users need to enter a payment page to pay a fixed fee to use the upgraded version. In other words, if there are more paying users, Slack’s revenue will theoretically be higher, and its financial results will look better.
The traffic on paid pages shows that fewer and fewer users are willing to pay . By summing up the proportion of traffic on the desktop paid page, you canIn order to find that its traffic trend continues to decline, the number of users who come to the paid page gradually decreases.
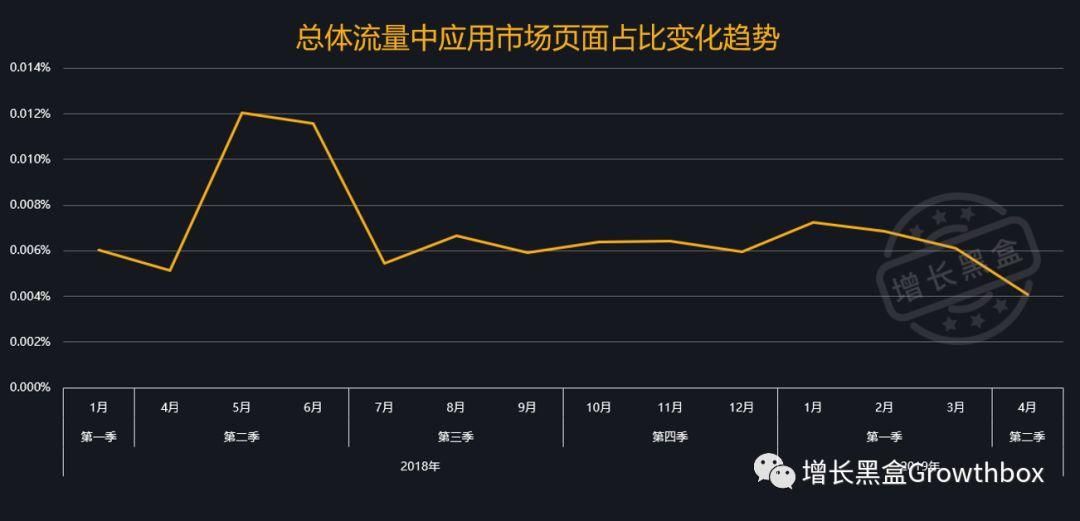
4. Third-party application growth slows down
The proud feature of Slack products is that they can integrate many third-party applications, such as Github, Google Drive, etc., and can develop their own integrated applications according to the API published by Slack. This feature is described in the prospectus as The Slack Platform, which shows its ambition to become a one-stop office platform.
Judging from the traffic of application access pages, its growth in this area has also encountered a bottleneck. If users need to know or want to access third-party apps, they have to come to the slack.com/apps page. We analyzed the change in the traffic ratio of this page and found that it was in May 2018. There were substantial visits in June and June, but the development has been moderate since then, and even after entering 2019, it has shown a slight downward trend. It can be seen that fewer and fewer users come to this page to find applications.
It seems that Slack’s The growth of the business is not satisfactory, and it can even be said that the media has been “blown” too far. From these basic traffic data, we do not see the trend of high-speed growth at all, but instead see growth bottlenecks.
We have organized traffic trends based on user behavior. As shown in the figure below, you can see several key nodes, and the proportion of traffic is falling.
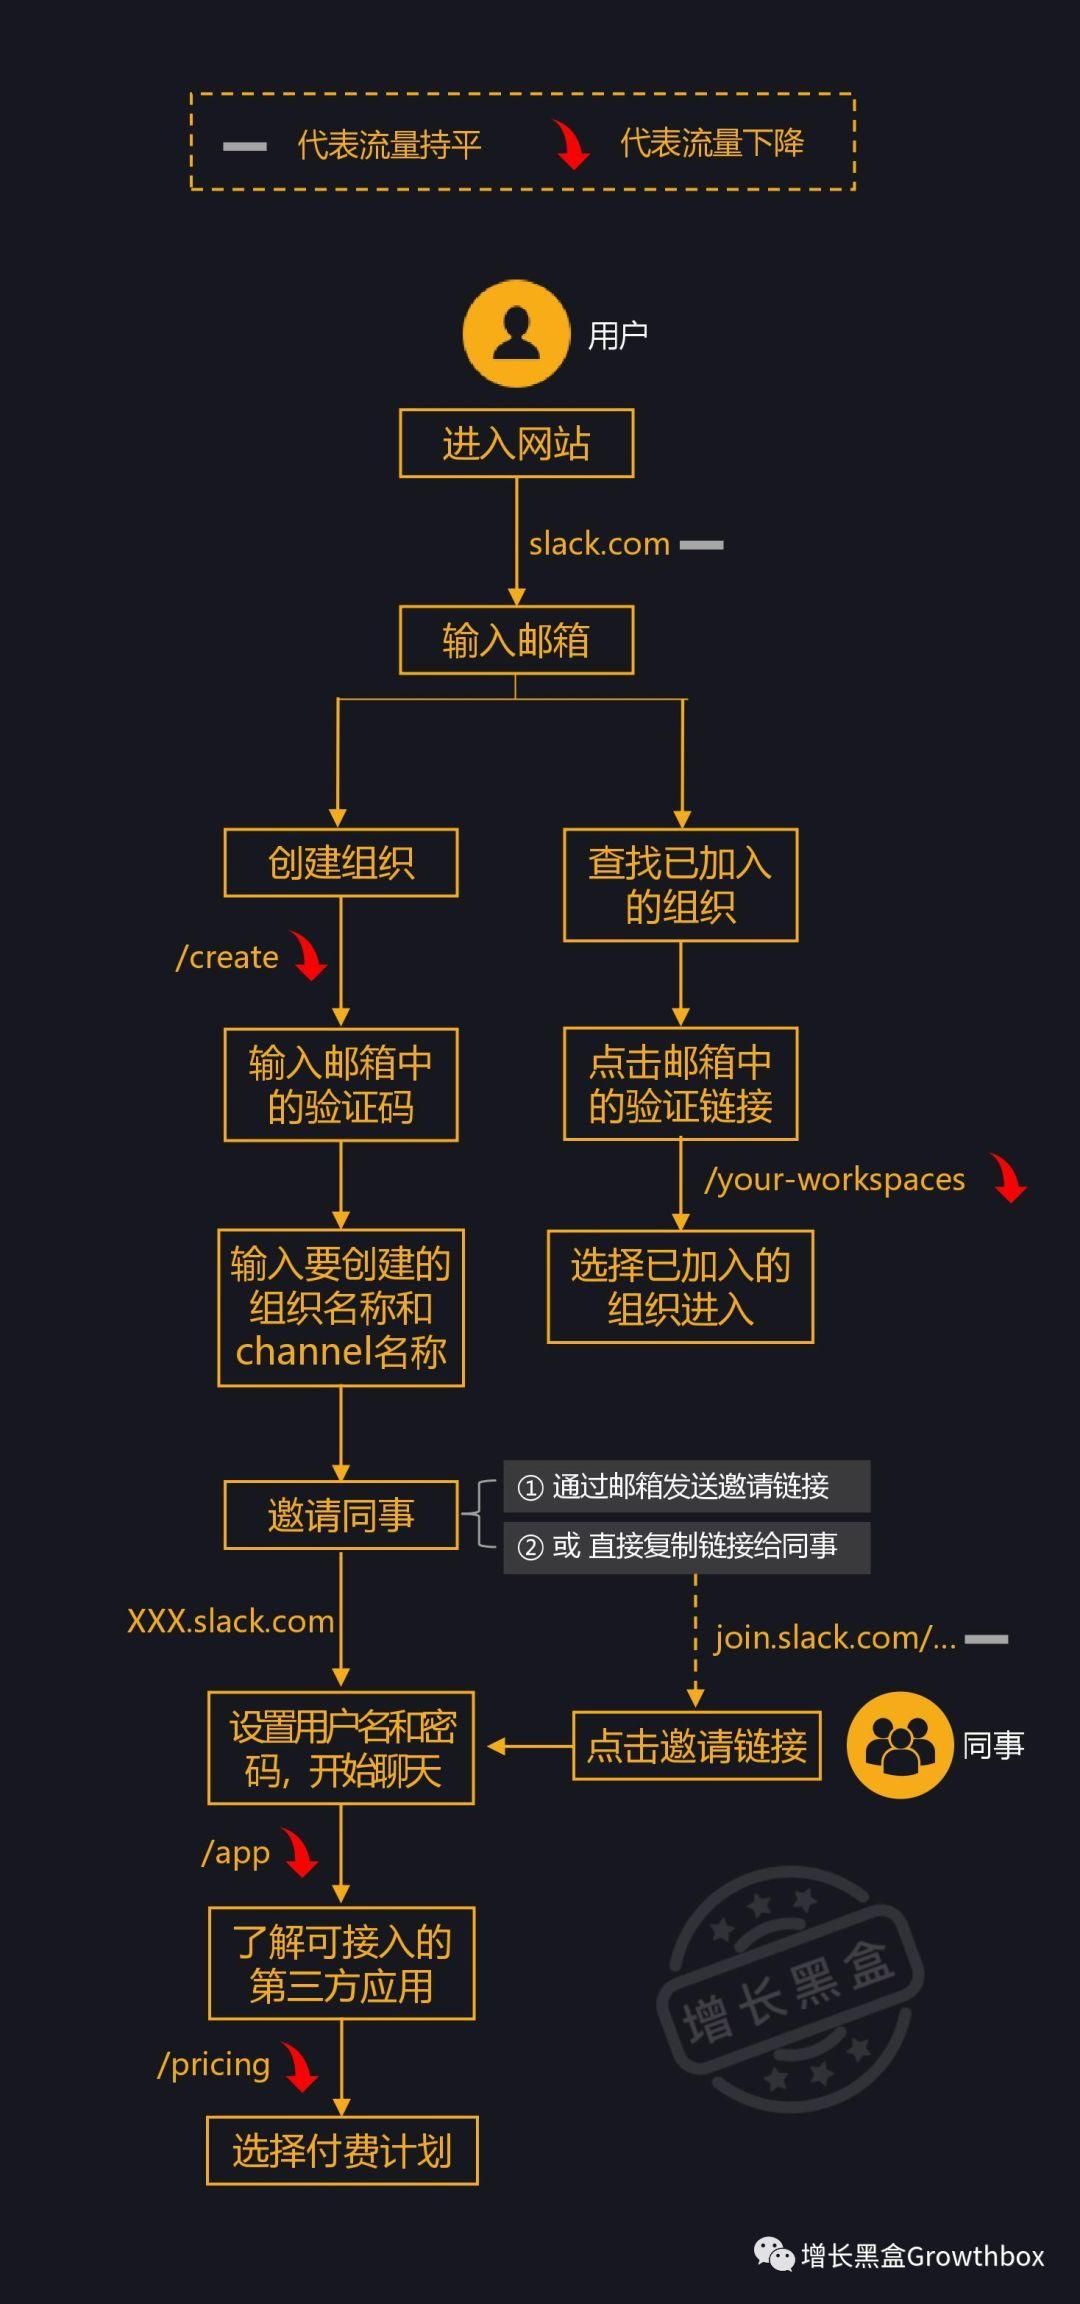 Comprehensive prospectus, recruitment and other data, we have calculated the possible problems of Slack in advance. The data in the first financial report after listing is likely to be lower than market expectations, causing the stock price to fall:
-
1. Slower user growth
-
2. Slower growth in paid users
-
3. Revenue growth is lower than market expectations
-
4. Old users’ ability to continue to pay declines
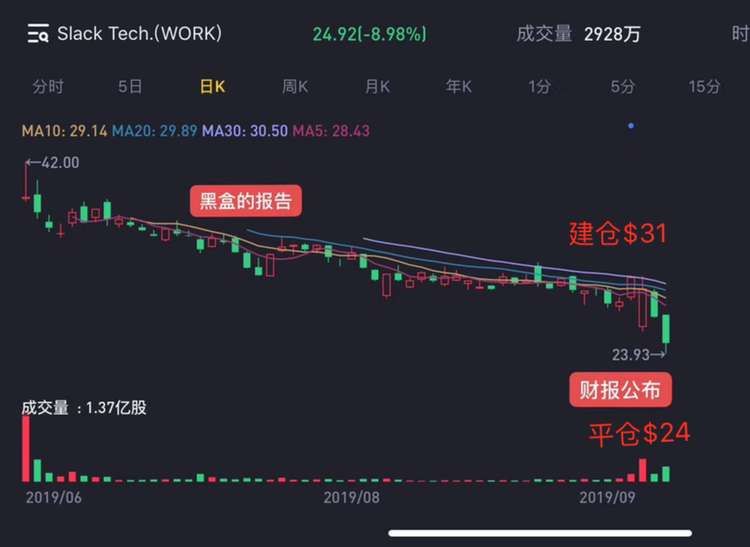
So we have adopted a short strategy. The day before the earnings report was released, we opened a short position at $ 31 per share. Sure enough, after the release of the financial report the next day, Slack’s business data released was in line with our inference, far lower than market expectations, and the stock plummeted. So we closed the position at $ 24 per share.
Deducting the short processing fee, we make 20% in one day.
You may have many questions : Why can you predict the financial performance of listed companies based on these data? Is this all luck?
In fact, whether it is website traffic, e-commerce sales, advertising, social media, or even satellite image data, it is called “alternative data” strong> . In the financial industry, the use of alternative data for stock analysis and forecasting is already a very mature model. Financial institutions around the world spend billions of dollars every year to purchase these data.
Traditional secondary market analysis often relies on the data in the financial report. Although the amount of information is large, the response is slow-as mentioned earlier, the financial report releases the operating data of the previous quarter, and the gap is a full three months. And only released once a quarter. The alternative data can be obtained in real time, used to judge short-term trends, and even used to predict the results of financial reports in advance. If the two are organically combined, the market trend can be judged more accurately.
Let me give a magical example: There is a data company called Thasos in the United States. In 2018, it began to monitor the strength of mobile phone signals at employees of Tesla automobile factories. They believe that employees work overtime withTesla’s production capacity is directly proportional, the more overtime, the higher the output. By monitoring cell phone signals, Thasos is able to estimate employees’ overtime.
For Tesla, the biggest growth driver is mass production capacity. If the production capacity increases, it will inevitably promote the rise of the stock price.
Thasos found that in the third quarter of 2018, the working hours of employees at the Tesla factory increased significantly, and the proportion of night shifts increased by 30%. They judged that Tesla’s Q3 output would rise significantly.
Sure enough, data released by Q3’s financial report showed that Model3 output doubled, and Tesla’s stock price rose sharply by 9%. The financial institutions that cooperate with Thasos should be full of money.
Finally, let’s emphasize again that our article is not “stock market teaching”, but provides a novel idea to help everyone to study and explore the law of company growth. After all, whether you can make money or not depends on timing and luck.
Today ’s content is shared here, I hope to help everyone!
-
The start page after entering your email is slack.com/get-started,
-
Page slack.com/create when creating an organization,
-
The download address of the Windows client is slack.com/downloads/windows,
-
and select your own organization page slack.com/your-workspaces,
The proportion of traffic has decreased to some extent. This means that the proportion of users who visit Slack to register, create a business, and download clients is declining, which may reflect the lack of momentum for new user growth.3. The proportion of paying users has dropped
Slack’s model of making money is very simple. You can sign up for free, but some advanced features must be upgraded for a fee. Users need to enter a payment page to pay a fixed fee to use the upgraded version. In other words, if there are more paying users, Slack’s revenue will theoretically be higher, and its financial results will look better.
The traffic on paid pages shows that fewer and fewer users are willing to pay . By summing up the proportion of traffic on the desktop paid page, you canIn order to find that its traffic trend continues to decline, the number of users who come to the paid page gradually decreases.
4. Third-party application growth slows down
The proud feature of Slack products is that they can integrate many third-party applications, such as Github, Google Drive, etc., and can develop their own integrated applications according to the API published by Slack. This feature is described in the prospectus as The Slack Platform, which shows its ambition to become a one-stop office platform.
Judging from the traffic of application access pages, its growth in this area has also encountered a bottleneck. If users need to know or want to access third-party apps, they have to come to the slack.com/apps page. We analyzed the change in the traffic ratio of this page and found that it was in May 2018. There were substantial visits in June and June, but the development has been moderate since then, and even after entering 2019, it has shown a slight downward trend. It can be seen that fewer and fewer users come to this page to find applications.
It seems that Slack’s The growth of the business is not satisfactory, and it can even be said that the media has been “blown” too far. From these basic traffic data, we do not see the trend of high-speed growth at all, but instead see growth bottlenecks.
We have organized traffic trends based on user behavior. As shown in the figure below, you can see several key nodes, and the proportion of traffic is falling.
-
1. Slower user growth
-
2. Slower growth in paid users
-
3. Revenue growth is lower than market expectations
-
4. Old users’ ability to continue to pay declines
So we have adopted a short strategy. The day before the earnings report was released, we opened a short position at $ 31 per share. Sure enough, after the release of the financial report the next day, Slack’s business data released was in line with our inference, far lower than market expectations, and the stock plummeted. So we closed the position at $ 24 per share.
Deducting the short processing fee, we make 20% in one day.
You may have many questions : Why can you predict the financial performance of listed companies based on these data? Is this all luck?
In fact, whether it is website traffic, e-commerce sales, advertising, social media, or even satellite image data, it is called “alternative data” strong> . In the financial industry, the use of alternative data for stock analysis and forecasting is already a very mature model. Financial institutions around the world spend billions of dollars every year to purchase these data.
Traditional secondary market analysis often relies on the data in the financial report. Although the amount of information is large, the response is slow-as mentioned earlier, the financial report releases the operating data of the previous quarter, and the gap is a full three months. And only released once a quarter. The alternative data can be obtained in real time, used to judge short-term trends, and even used to predict the results of financial reports in advance. If the two are organically combined, the market trend can be judged more accurately.
Let me give a magical example: There is a data company called Thasos in the United States. In 2018, it began to monitor the strength of mobile phone signals at employees of Tesla automobile factories. They believe that employees work overtime withTesla’s production capacity is directly proportional, the more overtime, the higher the output. By monitoring cell phone signals, Thasos is able to estimate employees’ overtime.
For Tesla, the biggest growth driver is mass production capacity. If the production capacity increases, it will inevitably promote the rise of the stock price.
Thasos found that in the third quarter of 2018, the working hours of employees at the Tesla factory increased significantly, and the proportion of night shifts increased by 30%. They judged that Tesla’s Q3 output would rise significantly.
Sure enough, data released by Q3’s financial report showed that Model3 output doubled, and Tesla’s stock price rose sharply by 9%. The financial institutions that cooperate with Thasos should be full of money.
Finally, let’s emphasize again that our article is not “stock market teaching”, but provides a novel idea to help everyone to study and explore the law of company growth. After all, whether you can make money or not depends on timing and luck.
Today ’s content is shared here, I hope to help everyone!
-