Affected by the new coronary pneumonia epidemic, the implied default rate of credit in various industries in the United States has increased significantly, and has exceeded the level before the 2008 financial crisis, which has caused people to worry about the quality of bank assets. This is of course not limited to the United States. This article will start from the liquidity mismatch of the bank’s balance sheet and sort out the mechanism of the banking crisis.
Imagine that in a commercial society without banks, if an automobile company wants to raise money, it can only raise funds directly from the public. Since the investment period of the automobile industry is relatively long, it is assumed that 5-year bonds are issued and the principal and interest are paid at one time. Due to the low frequency of issuance, the bond of this auto company is extremely illiquid, which requires Pay a higher liquidity premium. In a society with banks, residents can choose to deposit funds in the bank at any time, and then the bank buys corporate bonds. The liquidity premium required by them is generally lower than that of individual investors, which helps reduce corporate The financing cost also creates liquidity for residents. However, it itself bears liquidity risk, which is manifested in the maturity mismatch (or liquidity mismatch) on both sides of the balance sheet. The interest spread is actually a compensation for banks to bear liquidity risk. Generally speaking, the term of the bank ’s liability side is relatively short. For demand deposits, there is still uncertainty about the outflow of funds, while the term of the asset side is relatively long, and the certainty of cash flow is relatively high. Therefore, the sensitivity of its assets and liabilities to the macro economy will be different.
The balance sheet of financial intermediaries
The balance sheet of financial intermediaries
One of the core management tasks of financial intermediaries is cash flow management, which uses cash flows on the liability side to determine assets Liquidity and risk exposure. Short-term debt needs to be matched with low-risk and high-liquidity assets, while assets corresponding to long-term debt can have certain risks, and liquidity requirements can also be reduced. Table 1 is a simplified form of the balance sheet, assuming that low-risk, high-liquidity assets perfectly match short-term debt. Such assets include cash and money market funds. After matching the short-term debt, the financial intermediary will have some flexibility in portfolio management. Some assets can be invested in assets with certain risks but with relatively high liquidity, such as equity investments. By analogy, some assets can also be invested in assets with higher risks but lower liquidity, such as high-yield non-financial corporate bonds or alternative investments.

Source: Draw by the author
Source: Draw by the author
This is a simplified form, different The types of financial intermediaries have very different balance sheet structures. As banks, especially systemically important banks, are prone to cause systemic financial risks and economic recession, the asset classes and liquidity requirements they can invest in have strict regulations. For example, after the 2008 financial crisis, Basel III added two new liquidity requirements for banks:
(1) Liquidity coverage ratio (Liquidity Coverage Ratio (LCR), which requires banks to have sufficient high-quality liquid assets (HQLA) to pass the 30-day standardized stress test, that is, to cover at least the next 30 days of net cash outflow (NCOF) ). Among them, high-quality current assets include two major categories, primary assets include cash, reserves deposited with the central bank and some securities supported by the state, public sector entities and the central bank. In general, these assets have no restrictive clauses and no valuation discount (haircut), and can be mortgaged or sold at market value; secondary assets include 2A and some 2B assets, these assets generally have 25-50% The discount rate should not exceed 15%.
(2) Net Stable Funding Ratio (NSFR), which requires the bank ’s available of stable funding (ASF) to exceed the normal operation of the bank for more than one year The amount of required stable funds (RSF) required focuses on maintaining a safe margin of long-term liquidity (Berger and Bowman, 2019).
Liquidity coverage ratio was implemented globally on January 1, 2015, with an initial minimum requirement of 60%, and then increased by 10 percentage points annually, to January 2019 It will be executed at 100% starting from the 1st. The United States issued the final rules in October 2014. There are two versions. One is comprehensive LCR regulation, targeting large internationally active banks and their U.S. subsidiaries; the other is relatively loose and adjustable LCR regulation. , The object is a large regional bank holding company. Smaller institutions are not subject to LCR.
The United States has a strict definition of high-quality liquid assets, excluding securities issued or guaranteed by the public sector, nor MBS, and corporate bonds are prohibited from being included in Class 2A bonds. The use of external ratings is prohibited. Even if the LCR regulatory requirements are met, additional stress testing on the peak date of capital outflows will be accepted. The implementation in the United States is also faster, requiring banks subject to full LCR regulation to reach at least 80% on January 1, 2015. The “Walker Rules” enacted during the Obama era separated the main business of commercial banks from proprietary trading accounts, prohibiting banks from using federal deposit insurance deposits for proprietary trading and investing in hedge funds or private equity funds. It can be seen that since the financial crisis in 2008, the United States has strengthened its supervision of the banking industry, which is why the collapse of the US stock market in 2020 did not affect the banking industry.
Under normal circumstances, the balance sheet risk of financial intermediary structure is generally controllable, but when the black swan event occurs, it is prone to liquidity shortage and lead The phenomenon of asset sales and run-offs, such as AIG and Washington Mutual Bank (AIG), which was one of the largest insurers in the United States after the indebtedness of the 2008 financial crisis and had to accept government assistance The second largest commercial bank in the United States is caused by problems with real estate mortgage loans, except that the former is a problem on the liability side and the latter is a problem on the asset side. By mid-2008, AIG had accumulated insurance for debt-backed securities (CDOs) worth $ 500 billion, while Washington Mutual Bank issued a large number of mortgage loans and held a certain portfolio of mortgage assets. Since 2007, there have been defaults on mortgage loans in the United States, which has increased the burden of cash flow on AIG ’s liability side and reduced the quality and quantity of WaMu ’s asset side. There will be a resonance situation between the cash outflow pressure on the liability side and the pressure on the asset side sell-off. In this process, the capital ratio will continue to decline, and finally there will be a situation where the net assets are negative and the debt is insolvent.
U.S. commercial bank balance sheet
Table 2 is the consolidated balance sheet of US commercial banks. As of February 2020, the total assets were US $ 17.9 trillion. Among them, the total assets of US domestic banks are 15.7 trillion US dollars, accounting for 87.7%. Among local banks, the total assets of large banks are US $ 10.3 trillion, accounting for 65.6%. The asset side represents the use of funds, and the proportion from high to low is loan and lease (56.12%), certificateBonds (21.55%), cash (9.72%), other assets (8.68%) and federal funds for sale and repurchase (4.51%). Among loans and leases, real estate mortgage loans account for the highest proportion, accounting for 25.83% of total assets, and commercial and residential accounts for about half each. In securities investment, it is mainly the debts of government bonds and government-backed institutions, such as the bonds of Fannie Mae and Freddie Mac. Consumer loans are mainly credit cards and car loans, the former accounts for half of consumer loans.
The structure of the liability side is relatively simple, with deposits accounting for three quarters; the capital ratio is 11.26%, which is an increase compared to before the 2008 financial crisis, but the relative The ratio dropped by another 1.5 percentage points in 2010, which also means that the banking industry as a whole has 9 times leverage (total assets / capital).
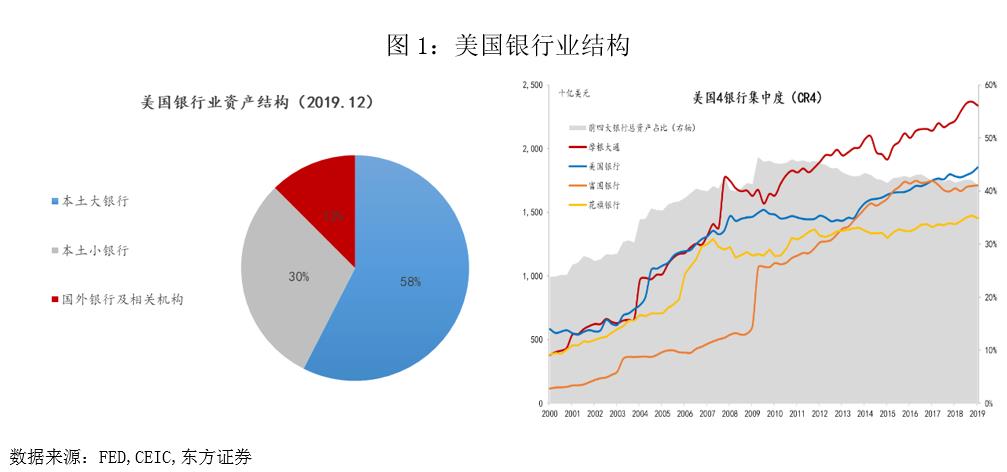
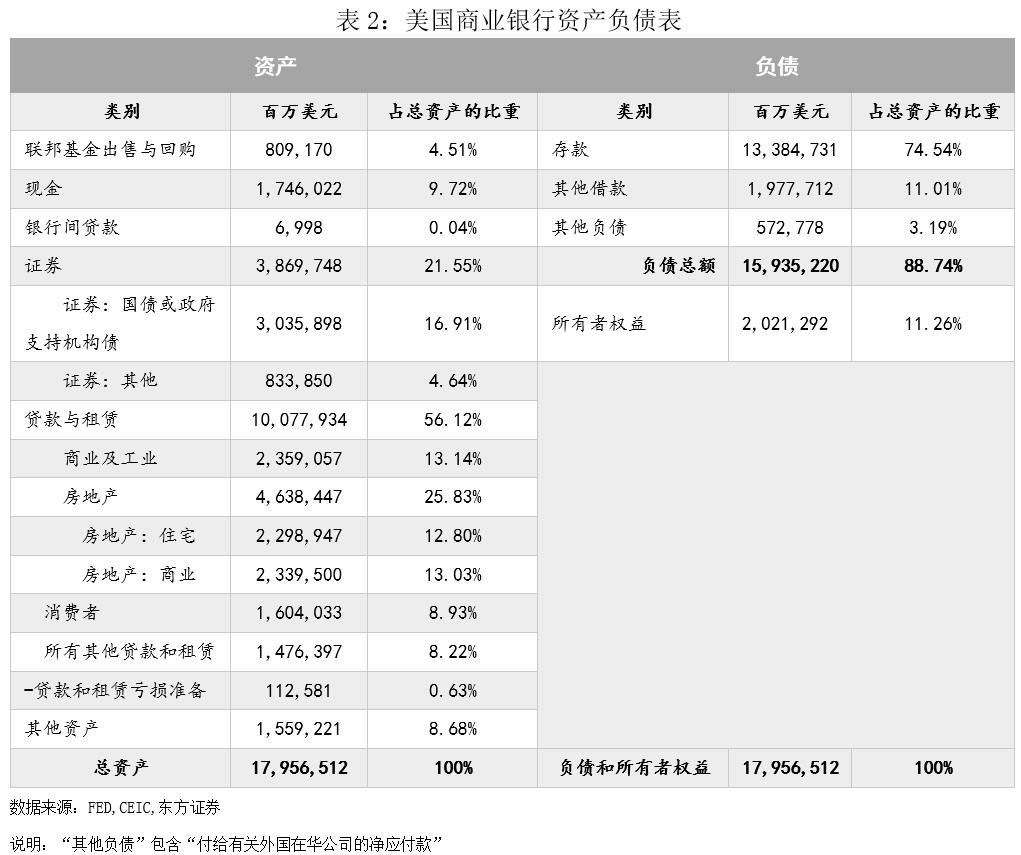 In the total banking assets of about US $ 18 trillion, the top 4 commercial banks—JP Morgan Chase, Bank of America, Wells Fargo, and Citibank—accounted for 40% ( Figure 1 ), the peak in September 2011 was 46%. Among them, the largest is JPMorgan Chase, which is currently the only bank with more than 2 trillion US dollars. The total assets of Bank of America, Wells Fargo and Citibank are 1.85, 1.71 and 1.45 trillion US dollars respectively.
 Taking JP Morgan as an example to elaborate the structure of the balance sheet of US commercial banks ( Table 3 ). The largest asset side is loans (and leases), which is 0.96 trillion US dollars, accounting for 41% of its total assets. Among them, residential and commercial real estate loans are about 370 billion, accounting for 16% of total assets; followed by It is securities (US Treasury bonds, government-backed bonds, ABS, MBS, etc.), about 400 billion yuan, accounting for 17%; third is cash and deposit industry, with a scale of about 260 billion, accounting for 11.28%; the debt side, about 16500 Billion, accounting for 70%; The capital is 250 billion, and the equity capital ratio is equal to 10.5%.
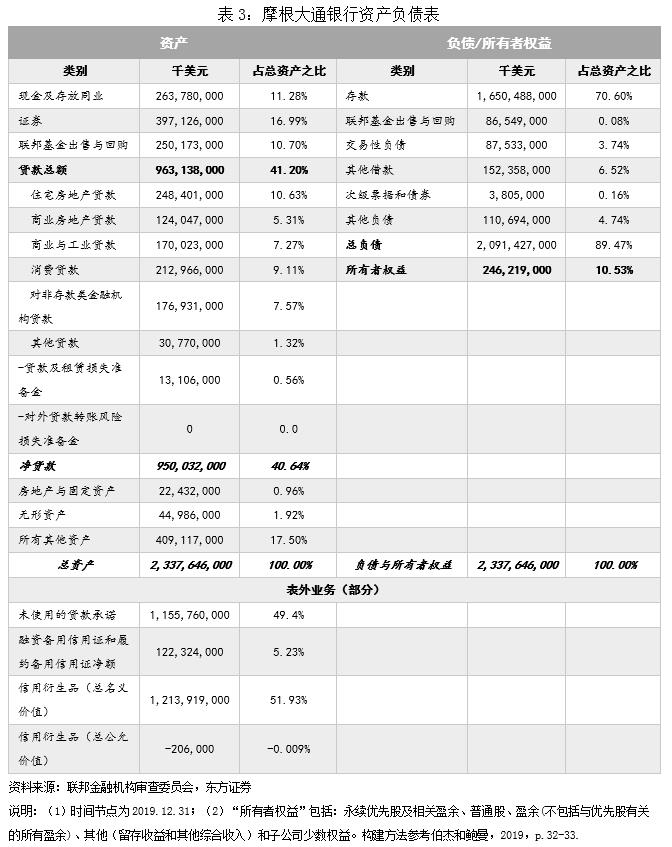 Super large commercial banks also have considerable off-balance sheet business. JPMorgan Chase ’s unused loan commitment is 1.16 trillion yuan, accounting for about 50% of total assets, exceeding the on-balance sheet loans by 9 percentage points, but This is a significant drop from 2008. The nominal value of credit derivative contracts is 1.2 trillion. At the end of 2014 before the implementation of Basel III, the total size of JPMorgan ’s derivatives contracts (nominal value) was US $ 63.7 trillion, 30.7 times its total assets (Berger and Bowman, 2019). This includes both the buyer’s position and the seller’s position, and the buyer’s position and the seller’s position of similar derivatives can be basically hedged, so the net value of the derivative contract is relatively small. At the end of 2019, JPMorgan Chase had a net loss of $ 200 million on credit derivative contracts.
In the total banking assets of about US $ 18 trillion, the top 4 commercial banks—JP Morgan Chase, Bank of America, Wells Fargo, and Citibank—accounted for 40% ( Figure 1 ), the peak in September 2011 was 46%. Among them, the largest is JPMorgan Chase, which is currently the only bank with more than 2 trillion US dollars. The total assets of Bank of America, Wells Fargo and Citibank are 1.85, 1.71 and 1.45 trillion US dollars respectively.
Taking JP Morgan as an example to elaborate the structure of the balance sheet of US commercial banks ( Table 3 ). The largest asset side is loans (and leases), which is 0.96 trillion US dollars, accounting for 41% of its total assets. Among them, residential and commercial real estate loans are about 370 billion, accounting for 16% of total assets; followed by It is securities (US Treasury bonds, government-backed bonds, ABS, MBS, etc.), about 400 billion yuan, accounting for 17%; third is cash and deposit industry, with a scale of about 260 billion, accounting for 11.28%; the debt side, about 16500 Billion, accounting for 70%; The capital is 250 billion, and the equity capital ratio is equal to 10.5%.
Super large commercial banks also have considerable off-balance sheet business. JPMorgan Chase ’s unused loan commitment is 1.16 trillion yuan, accounting for about 50% of total assets, exceeding the on-balance sheet loans by 9 percentage points, but This is a significant drop from 2008. The nominal value of credit derivative contracts is 1.2 trillion. At the end of 2014 before the implementation of Basel III, the total size of JPMorgan ’s derivatives contracts (nominal value) was US $ 63.7 trillion, 30.7 times its total assets (Berger and Bowman, 2019). This includes both the buyer’s position and the seller’s position, and the buyer’s position and the seller’s position of similar derivatives can be basically hedged, so the net value of the derivative contract is relatively small. At the end of 2019, JPMorgan Chase had a net loss of $ 200 million on credit derivative contracts.
In the Federal Reserve ’s statistics, there are 31 large commercial banks, and the others are small banks. Take savings and loan institutions as an example. Most of their assets are within 100 million US dollars. Of course, there are a few more than 10 billion US dollars. For example, the Washington Mutual Bank mentioned above is one of them. The other is IndyMac. Bank), both banks went bankrupt during the 2008 financial crisis. The business boundaries of large commercial banks and savings institutions are becoming more and more blurred. The latter can also issue loans and absorb deposits, but there are still comparative differences in the balance sheet structure of the two. Generally speaking, commercial real estate loans and MBS of savings institutions account for a relatively high proportion, and cash and deposits account for a relatively low proportion, and there are few industrial and commercial loans and off-balance sheet businesses. In other words, the asset side of savings institutions is closely connected with real estate, and the financing methods are mainly savings deposits and capital.
Three major banking reshuffles in American history
Three major banking reshuffles in American history
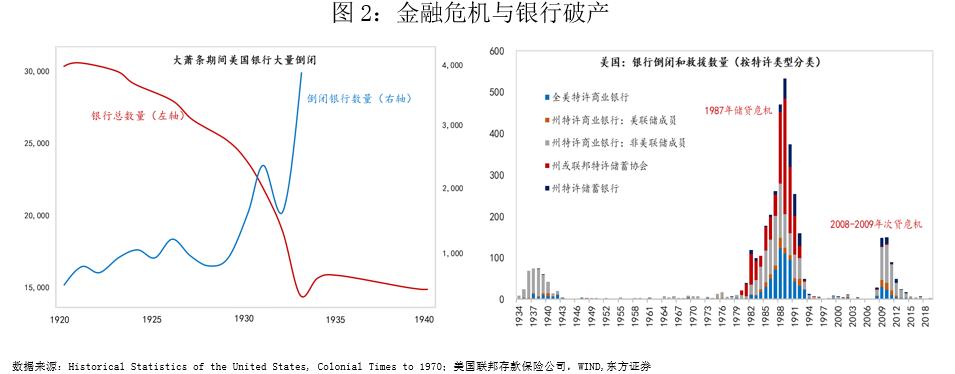
In 1920, a hundred years ago, there were more than 30,000 banks in the United States. There are only about 5,000 remaining, and the concentration of the banking industry is constantly increasing, CR4 exceeds 40%. Every financial crisis is a reshuffle of the banking industry. There are three more prominent banking reshuffles in American history: the Great Depression of 1929-1933; the savings and loan crisis that began in 1987; 2008-2009 years of financial crisis. From 1920 to 1929, the US banking industry went bankrupt on an average of 500 banks per year. Before the outbreak of the Great Depression in 1929, the number of Bank of America fell to 25,000, and during the Great Depression, about 10,000 banks went bankrupt. It peaked in 1933, and about 4,000 companies went bankrupt that year ( Figure 2 ). Banks are the most important financial intermediaries to create liquidity, and the final link for financial services to the real economy. The result of bank failures is a contraction of credit, which in turn leads to a break in the corporate capital chain. During the Great Depression, 32,000 U.S. companies went bankrupt, and the unemployment rate reached 25%.
 Bankruptcy during the Great Depression and the resulting credit contraction were the cause of the long-term economic depression. Milton Friedman therefore criticized the Fed ’s laissez-faire for credit contraction. Implemented a tight monetary policy. Friedman believes that without a credit contraction, the Great Depression would not occur. In order to get rid of the Great Depression, the Emergency Banking Act of 1933 granted the Federal Reserve and the Treasury with unprecedented power to rescue financial institutions and the real economy. The Federal Deposit Insurance Corporation (FDIC) was also established to prevent bank runs during the crisis. Accelerate bankruptcy. In fact, the current basic framework of monetary and fiscal policy was established during the Great Depression, including the so-called quantitative easing (QE) policies that existed during the Great Depression. The banking act signed by President Hoover in February 1932 — the Banking Act of 1932 — granted the Fed the power to purchase US Treasury bonds.
Bankruptcy during the Great Depression and the resulting credit contraction were the cause of the long-term economic depression. Milton Friedman therefore criticized the Fed ’s laissez-faire for credit contraction. Implemented a tight monetary policy. Friedman believes that without a credit contraction, the Great Depression would not occur. In order to get rid of the Great Depression, the Emergency Banking Act of 1933 granted the Federal Reserve and the Treasury with unprecedented power to rescue financial institutions and the real economy. The Federal Deposit Insurance Corporation (FDIC) was also established to prevent bank runs during the crisis. Accelerate bankruptcy. In fact, the current basic framework of monetary and fiscal policy was established during the Great Depression, including the so-called quantitative easing (QE) policies that existed during the Great Depression. The banking act signed by President Hoover in February 1932 — the Banking Act of 1932 — granted the Fed the power to purchase US Treasury bonds.
The second outstanding banking crisis is called the “1987 Storage and Loan Crisis”, and the story begins in the late 1970s. After the Great Depression, the United States strengthened supervision of the banking industry, such as strict controls on interstate operations and deposit and loan interest rates. With the changes in the monetary system and the macroeconomic environment, the US banking industry began the process of liberalization beginning in the mid and late 1970s. The “Depository Institution Deregulation and Monetary Control Act” passed in 1980 allowed, for the first time, the Savings and Loan Association to accept check deposits, issue floating-rate mortgages and consumer loans, and carry out trust businesses, all of which originally belonged to commercial banks; The “Garn-St. Germain Act” first approved that the Savings and Loan Association can make safe and unsafe commercial loans, including junk bonds; in 1986, the upper limit of deposit interest rate was removed-“Q Regulation”.