Almost all banking crises first manifest as liquidity crises, concentrated as asset value losses. Once the loss exceeds the capital, the liquidity crisis evolves into a payment crisis. The reason for the liquidity crisis of banks is precisely the creation of too much liquidity, so that their own liquidity is lacking.
Liquidity creation and insufficient liquidity
Liquidity creation and insufficient liquidity
In economic analysis, researchers often use the bank ’s total assets or credit size to measure the bank ’s created liquidity This method has the following problems:
First, it ignores off-balance sheet business. On the whole, off-balance sheet business can explain the liquidity creation of the US commercial banking system. About half (Berger and Bowman, 2019, p. 26).
Second, it ignores the difference in liquidity of different types of assets or loans;
Third, no Consider the liquidity difference of liability items; only when a commercial bank converts illiquid assets (such as commercial loans) into liquid liabilities (such as transactional deposits) can it be called that it has created liquidity, otherwise, if it is Converting liquid assets (such as securities) into illiquid liabilities (such as subordinated debt), or owner’s equity, instead destroys liquidity.
That is to say, if the proportion of commercial banks ’illiquid assets is higher, the proportion of liquid liabilities is lower, and it is kept to a minimum while meeting regulatory requirements The limited capital ratio, the more liquidity it creates. But at the same time, it itself faces higher liquidity risks. In the face of liquidity shocks, with the increased pressure of cash outflows on the liability side, assets have to be sold (or mortgaged) at a higher discount rate. When the value of assets exceeds the capital, they have to enter the bankruptcy liquidation link .
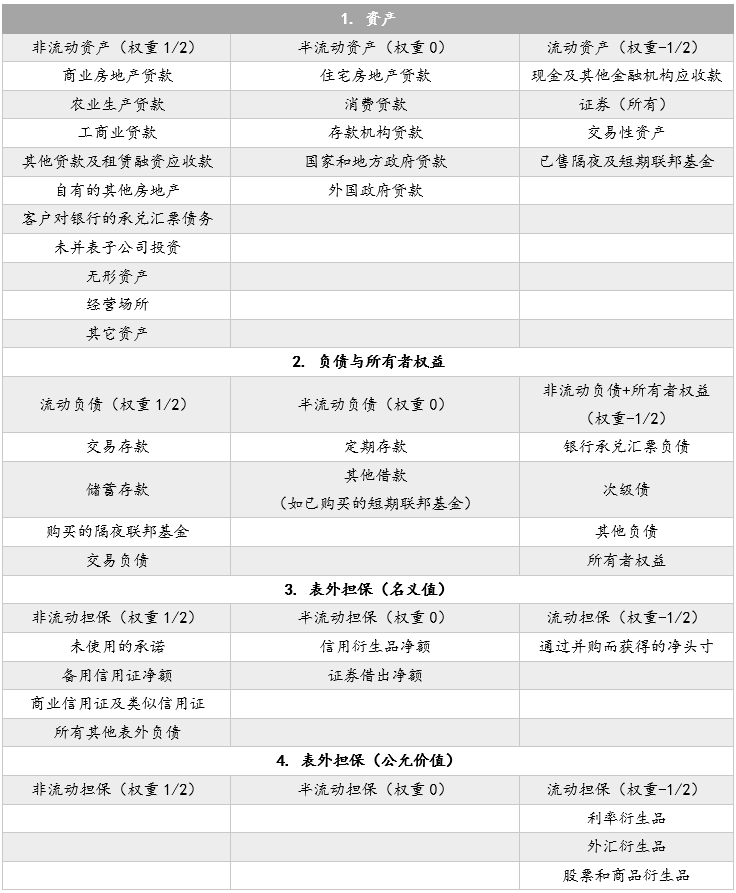
Berger and Bowman (2019) proposed a liquidity measurement method for banks “product wide caliber”. This method divides assets, liabilities (and owner’s equity) and off-balance sheet business into three categories of liquidity, semi-liquidity and illiquidity, respectively, and empowers and aggregates them to obtain the total liquidity created. The division method is shown in Table 1 . The weights of non-current assets, current liabilities and off-balance sheet non-current guarantees are all 1/2, current assets, non-current liabilities, owner ’s equity and non-current guarantees The weight is -1/2, and the weight of all semi-liquid projects is 0.
Table 1: Liquidity division of on- and off-balance sheet items of commercial banks
Source: Berger and Bowman, 2019, p.45-47
Table 1: Liquidity division of on- and off-balance sheet items of commercial banks
Source: Berger and Bowman, 2019, p.45-47
< The purpose of / div> setting the weight to 1/2 is to avoid double calculation. In this way, if a $ 1,000 commercial real estate loan is converted into a $ 1,000 demand deposit, then a liquidity of $ 1,000 is created; if it is converted into a fixed deposit of $ 1,000, the liquidity created is $ 500; If it is converted into a subordinated debt of $ 1,000, then the created liquidity is 0; if the bank converts a $ 1,000 liquid asset (such as a trading asset) into a corresponding amount of non-current assets or owner’s equity, instead Will destroy the liquidity of $ 1,000.
The more liquidity you create, the more benefits you will get, but you also have to take greater risks. In extreme cases, when the asset side of the bank is all illiquid assets and the liability side is all liquid liabilities, while maintaining a minimum capital ratio, the bank will maximize returns. However, what banks really care about is the Sharpe ratio, which is the risk-adjusted return, not the absolute return. Therefore, banks must maintain a certain percentage of liquid assets to match the size of the liabilities on the liabilities side.
Liquidity shock and balance sheet reconstruction
Generally speaking, Bank balance sheet accounts are priced at market value, so any changes in asset prices will cause passive adjustment of the balance sheet.
The characteristics of a bank ’s balance sheet are that assets have a long duration and liabilities have a short duration, so when the interest rate falls, the value of the asset will appreciateGreater than liabilities, on the contrary, when interest rates rise, the value of assets shrinks more than liabilities. This is why banks’ balance sheets become more vulnerable as the Fed raises interest rates.
Once a bank has a liquidity shortage, it can first borrow short-term funds to alleviate the pressure on capital outflows on the liability side, either unsecured loans or Mortgage loan. If the liquidity shock is systematic, that is, it is not a bank that has a liquidity crisis, but the entire interbank market, which means that most commercial banks need to borrow money. At this time, asset prices will generally fall rapidly, the amount of funds that can be borrowed by mortgages will also decrease, and the discount rate may also be higher. For example, the discount rate is 20% under normal conditions, but under liquidity shortage, the discount rate It may increase to 50%.
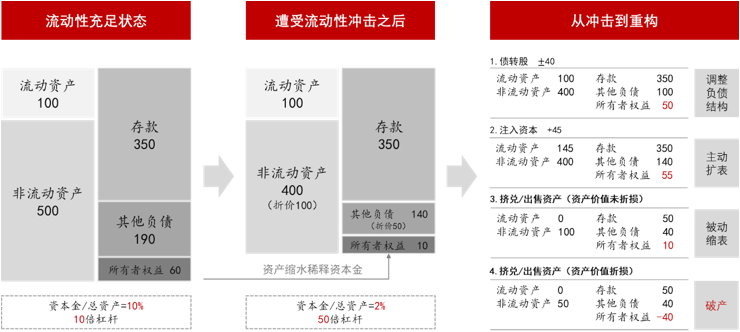
Figure 1 illustrates the bank ’s response to liquidity shocks in a simplified balance sheet. The initial total assets are 600, including 100 current assets and 500 non-current assets. The initial deposit is 350, other liabilities are 190, and the owner’s equity is 60, so the capital ratio is 10%. Macroeconomic fluctuations have reduced the value of non-current assets by 100, to 400, and the value of other liabilities by 50, to 140, and a net loss of 50. This is reflected in capital, which is from 60 to 10, and the proportion of capital is reduced to 2% , Which does not meet the minimum capital requirement. To return the capital ratio to the initial level, the bank must adjust its balance sheet. Alternative methods include:
Figure 1: Liquidity shock and bank balance sheet reconstruction
Source: Eastern Securities
First, adjust the structure on the liability side , Such as debt-to-equity swaps, converts 40 of other liabilities into owner’s equity.
Second, take the initiative to expand the table, such as the introduction of new strategic investors (45) to raise the owner ’s equity to 55, while at the same time, current assets rose to 145. If the current assets are greater than the current liabilities at this time, the bank can convert some of the current assets into non-current assets (such as the issuance of commercial real estate loans) in order to obtain income; on the contrary, if the current assets are still less than the current liabilities, you need to part Assets are converted into current assets.
Third, shrinking tables can be either active or passive. The way to actively reduce the balance sheet is to sell assets and use cash to pay off debts. This method and the two methods mentioned above are relatively benign. If the liquidity shock is systemic, other units will also adjust the balance sheet, and there may be a run on the liability side, thus having to passively shrink the balance sheet. For example, the household sector or other financial institutions may worry about bankruptcy, thereby reducing the position of savings deposits or interbank deposits, which will be reflected in the decline in the amount of deposits. If the liquidity requirement on the liability side is within 100, the bank can be supported by liquid assets. If the demand is greater than 100, the bank must sell non-current assets. When the asset scale is reduced to 100, the bank’s capital ratio will rise to 10%. This is also achieved under the assumption that the asset value has not been lost. If the value of the asset is compromised, there is a high probability that the bank will file for bankruptcy or bailout because it is insolvent. This is the fourth situation shown in the figure.
The four ways to reconstruct the balance sheet shown in Figure 1 can also be viewed as a progressive relationship. Since the loss of value (or discount rate) is inversely proportional to the liquidity level of the asset, under normal circumstances banks always sell liquid assets first, wait until the current assets drop to 0, and then sell non-current assets.
In the case of systemic liquidity shocks, the pressure of asset selling will continue to lower the market price of assets. However, the debt remains in nominal rigidity. For example, a deposit of 100 yuan is still 100 yuan in any case. In this process, capital is gradually being eroded, and banks with lower capital ratios are less able to withstand shocks. Therefore, whether the bank can withstand the shock depends on whether the shock is systematic and the duration of the shock. From this perspective, it can be understood why central banks must play the role of “last lenders” when there is a liquidity shortage in the financial market. This can reduce the pressure on asset sales because assets can be mortgaged to the Fed. Gain liquidity; on the other hand, it can also avoid running between financial institutions. However, the premise of obtaining liquidity of the central bank is to use security assets as collateral. If there are not enough security assets, it will still go bankrupt.
The transmission mechanism of liquidity shock:Banking channels
The transmission mechanism of liquidity shock:Banking channels
Systemic liquidity shocks are most often triggered by a sharp fall in the price of certain important assets. However, once a chain reaction is triggered, the subsequent evolution path is not only related to the change in the price of this single asset, because in a state of liquidity shortage, the price of almost all risky assets will fall, and those liquidity risks are low. Will be sought after by the market. The liquidity shortage and the high volatility of asset prices, as well as the positive correlation of risk asset prices, coexist. In extreme cases, the prices of risk assets and safe assets will show a certain positive correlation, because at this time the only useful possibility Only cash. Since the establishment of the Bretton Woods system, this cash is the US dollar, and its level is the highest in terms of liquidity. Under the margin trading system, it is only USD that can make up the deposit.
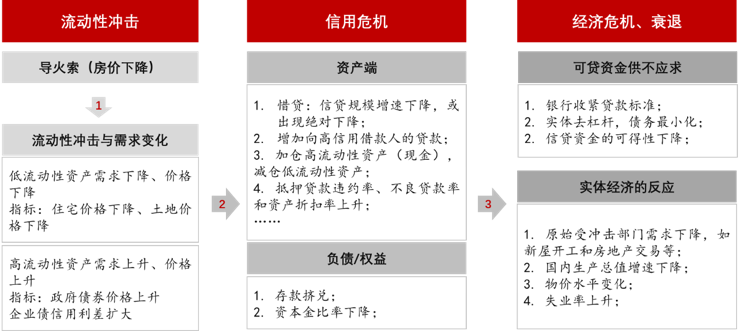
Real estate loans (residential and commercial) are the most important assets of banks, accounting for 25.83% of the total assets of the US banking industry. Among small banks, real estate loans account for as much as 43%. Therefore, the real estate market is an important source that affects the quality of bank assets. In history, every major banking crisis, such as the Great Depression of 1929, the Great Bubble of Japan in 1990 and the Financial Crisis of the United States in 2008, were closely related to the collapse of the real estate market to varying degrees. Therefore, falling housing prices are often the trigger for the banking crisis ( Figure 2 ).
Figure 2: From liquidity shock to economic recession (bank channel)
Source: Draw with reference to Chacko et al., 2011, Eastern Securities
Figure 2: From liquidity shock to economic recession (bank channel)
Source: Draw with reference to Chacko et al., 2011, Eastern Securities
The signal of liquidity shock can be determined by changes in asset prices with different liquidity, because liquidity is essentially a commodity, and the general principle of pricing is the relationship between supply and demand. In a state of liquidity shortage, highThe price of liquid assets will rise, and the price of low-liquidity assets will fall (or the discount rate will increase). In addition to the decline in the price of real estate assets, in the bond market, treasury bonds have higher liquidity (and credit) than corporate bonds, so the interest rate of treasury bonds will fall (prices will rise). Generally speaking, short-term Treasury bonds have larger interest rate declines and higher price increases than long-term Treasury bonds. Of course, as mentioned earlier, not all changes in bond interest rates are changes in liquidity premiums, but also credit risk premiums.
Bank adjustments in response to systemic liquidity shocks will trigger a credit crisis. When there is insufficient capital, the bank will either seek additional equity investment, such as public or non-public issuance of shares, or private placement, etc .; or supplement the capital with undistributed profits. However, these two methods are relatively slow. Therefore, the more common way is to sell assets and use the funds obtained to pay off debts. The result is that both sides of the balance sheet shrink simultaneously, and the capital ratio is increased due to the decline of the denominator.
As shown in Figure 1 , after suffering liquidity shocks, the bank ’s capital is only 10, and only the asset size is reduced from 500 100, the leverage can be reduced from 50 to 10. Moreover, this can only be achieved if the asset price is consistent with the book price. If the market price is lower than the book value, the capital will be further eroded. Conversely, if the market price is higher than the book value, the size of the asset to be sold will be less than 400. In addition to changes in the size of assets, banks will also adjust the asset structure, such as reducing loans to low-credit borrowers and lending only funds to high-credit borrowers, thereby reducing the use of capital. Because, different assets correspond to different capital buffer ratios.
The bank ’s balance sheet repair behavior is a manifestation of the credit crisis. The result is a reduction in the real economy ’s loanable funds, without financial support, the real economy ’s production, living and Consumer behavior will be affected. Therefore, with the credit contraction, there is also the bankruptcy of enterprises. During the Great Depression of 1929-1933, about 10,000 banks in the United States went bankrupt, but 32,000 companies went bankrupt, and the unemployment rate was as high as 25%. The record has been maintained so far.
Almost all economic recessions or depressions caused by the credit crisis are represented by a decline in GDP growth, a sharp decline in real estate investment, an increase in unemployment and an overall downward price. Of course, the specific situation also depends on the government’s countercyclical policy and the nature of the liquidity shock. If the liquidity shock is short-lived and unsystematic, and at the same time, the central bank and the Ministry of Finance have issued corresponding rescue measures in time, then it can effectively alleviate the impact of the credit contraction on the real economy. (Part 2The article will use the example of the Great Depression of 1929-1933 to illustrate the “ripple effect” of bank balance sheet adjustments.)
(Author Shao Yu is the chief economist of Oriental Securities, Chen Dafei is a macro analyst of Oriental Securities)