The world ’s largest derivatives exchange, the Chicago Mercantile Exchange (CME Group), announced on May 7 local time that its New York Mercantile Exchange Co., Ltd. (NYMEX) is taking measures to allow some natural gas futures contract prices and option contract lines The right price is negative and effective from May 17 (Monday, May 18 is the trading day). Under the premise of being ready, if market conditions permit, the exchange will provide support for the negative price of this part of the natural gas contract on or after the effective date. These contracts that introduce a negative price mechanism will be available for customers to test in the new version on May 11.
That ’s right, the announcement was that three “negative oil price” warnings were issued from April 3 to 15 and passed the negative oil price system test. CME Group’s daily settlement price of -37.63 USD / barrel of crude oil futures appeared.
The natural gas varieties mentioned in this announcement include LNG Japan / Korea Marker (Platts) Futures, Gulf Coast LNG Export Futures, Dutch TTF Natural Gas Daily Futures, etc. The natural gas transaction price benchmark, Henry Port Natural Gas Futures (code NG) is not included.

Announcement map
Announcement map
Since March this year, global attention has focused on the oil market But the natural gas market has also been hit hard, and the spread of the epidemic has exacerbated the oversupply situation in the global natural gas market.
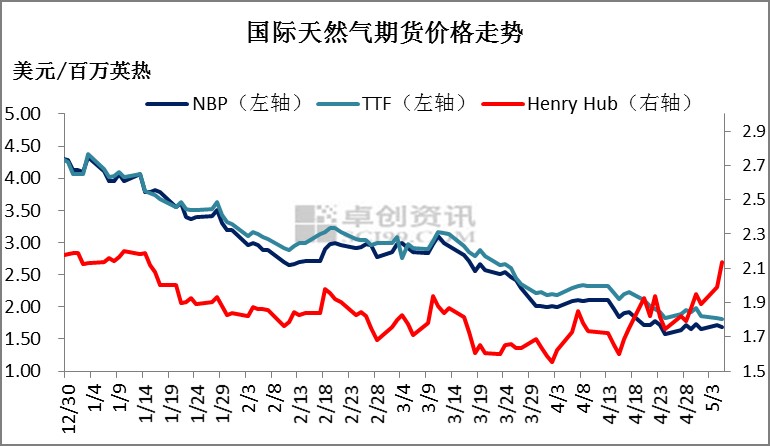
International natural gas futures price trends, source: Zhuo Chuang Information
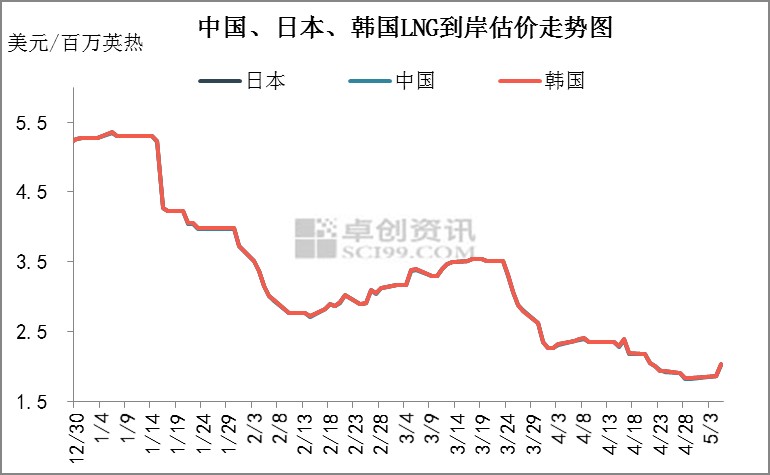
China, Japan, South Korea LNG CIF valuation chart, source: Zhuo Chuang Information
International natural gas futures price trends, source: Zhuo Chuang Information
China, Japan, South Korea LNG CIF valuation chart, source: Zhuo Chuang Information
Due to mild weather, sharp drop in fuel demand, pipeline maintenance in the Permian Basin, and other reasons, April 20 (almost at the same time as WTI crude oil futures fell out of the “live long” negative price), last year was repeated Spot natural gas prices at the Waha hub in West Texas, which experienced negative prices, fell out of record lows.
The main factors affecting the supply and demand situation and expectations of the US natural gas are weather, inventory and production. In terms of supply and demand, the US Energy Information Administration report shows that as of the week of April 24, US natural gas inventories were 221 billion cubic feet, an increase of 70 billion cubic feet from the previous week; inventory was 783 billion cubic feet higher than the same period last year, an increase of 54.9% ; 360 billion cubic feet higher than the 5-year average, an increase of 19.5%.