Despite the difficulty, the operation of the market is predictable to a certain extent.
Editor’s note: This article is Excerpted from “Forecasts: Economics, Cycles, and Market Bubbles”, author :Hong Hao.
The market is like a mirror of the economy, a distorted and exaggerated reflection of economic operations. Predicting the market is essentially to find some laws of market operation, and assume that these historical laws will remain roughly unchanged when predicting the future. The results of my research over the years have shown that, despite the difficulty, the operation of the market is predictable to a certain extent. Generally speaking, once a market trend starts, it will follow a certain trajectory, run to the extreme in a certain time and space, and then reverse.
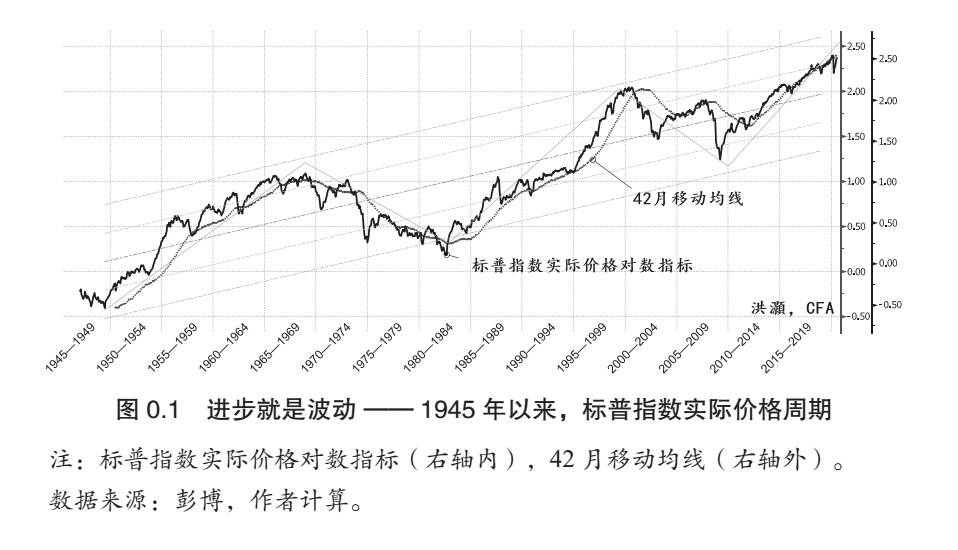
Figure 0.1 shows the 35-year volatility cycle of the real price logarithm of the Standard & Poor’s Index (hereinafter referred to as the S&P Index) since World War II. In other words, the operation of the market seems to have an endogenous cycle, and this endogenous cycle is largely driven by human expectations. The central bank’s monetary policy cannot change the operation of the cycle. On the contrary, the central bank’s monetary policy makes the formation of market expectations more extreme. This is because market expectations are self-adaptive and will continue to change due to past policy observations and experience accumulation, which will accelerate market prices and reflect policy changes in advance, and also make the market cycle more extreme.
Regularity of the cycle
Since the changes in business owners’ investment expectations will cause fluctuations in the business cycle, and the central bank, based on rational expectations, tries to rescue the market and stabilize expectations in the form of loose money in the form of market crises, then there are two logical conclusions It is obvious: First, the ups and downs of the economic cycle are related to the central bank’s monetary policy; second, because the central bank’s monetary policy choices are predictable, the cycle is also predictable.
In the past few years, I used my own cycle theory and model as the basis to predict the trend of the Chinese market every six months. In the end, most of these predictions were verified one by one by the actual situation of the market.
thanFor example, in 2016, my outlook for 2017 for the whole year was “a delicate balance”, and I forecasted the opportunities for large-cap stocks and Hong Kong stocks to investors.
The headings of my subsequent market outlook reports are: “A new high” in the second half of 2017, and “Infinite Scenery” in 2018 (this title is taken from the poem “Infinite Scenery in Dangerous Peaks”, but omitted “Xianfeng”, because the outlook for 2018 was published in early November 2017, there are still three months before the global market peaked at the end of January 2018, and the upward trend of the market in these three months was very violent), In the second half of 2018, “clouds fly over”, “turning the peaks” in 2019, “still water flowing deep” in 2020, and “diving dragons want to use” in the second half of 2020. After the market reached its peak in January 2018, it went all the way down until it “turned around” in 2019. The trend of the market over the past 4 years is roughly the same as the meaning implied by the title of my market outlook report over the years.
It is worth mentioning that these predictions are not the same as people’s expectations for future market trends at the time, and sometimes even completely different, but they are finally confirmed by the market. I have always believed that only an inflection point can change life, and only unique and continuously verified investment advice can truly add value to investors. These investment recommendations based on the cycle theory and model are not the capital that I can use from my praise, but some practical arguments that can be used to prove the validity of my cycle theory and model.
My quantitative research found that the short period of economic operation between China and the United States is 3 to 3.5 years. During the cycle, a large number of macroeconomic variables move in the same direction at a roughly constant speed simultaneously and regularly. Therefore, when establishing the cycle length, we only need to find the most critical set of variables that drive cycle operation, and then we can roughly deduce the direction and trend of other variables.
It is worth noting that when forecasting, I care about the trend and direction of economic variables, not their absolute level. Therefore, the cycle discussed in this book is a growth rate cycle, not an absolute horizontal cycle of economic operation. In fact, Japan’s economic growth during the so-called “lost 30 years” has been slowing down, but on the whole it has maintained positive growth. The continuous growth of the Chinese economy since the reform and opening up is obvious to all. Therefore, the Chinese economic slowdown we are discussing is strictly speaking, not the same as the Western economic recession, although it is manifested in the form of a slowdown in economic growth.
My research found that the ups and downs of China’s economic cycle, that is, the acceleration and slowdown of economic growth, are closely related to the activity of China’s real estate industry.
After analyzing and fitting several sets of real estate and related data to form a leading indicator of China’s economic cycle, we can see that in the past 20 years, China’s real estateCycleDrive China The economic cycle fluctuates forward with a length of 3~3.5 years. At the same time, the general trend of China’s economic cycle presents a long-term downward trend-the highs and lows of each short economic cycle are getting lower and lower. Of course, this long-term downward state is actually nothing to fuss about. In the long run, as China’s economy continues to grow, the rule of diminishing marginal effects in economics will become more and more obvious. The low point, that is, the change in China’s economic growth rate, will become smaller and smaller, and the volatility in the macro economy will gradually converge.
In addition, my research found that the short cycle of the U.S. economy is about 3.5 years, and its main leading indicator lies in U.S. investment in technology research and development, such as changes in semiconductor shipments and changes in the company’s capital expenditure plans. As well as other more traditional indicators, such as new housing starts, new housing approvals, new housing loan applications and other leading economic indicators.
The changes in these indicators also show the characteristics of periodic fluctuations-at the same time and regularly fluctuate in the same direction at approximately the same operating speed. When the China-US cycle enters the downward phase at the same time, the market will often experience substantial turbulence, although not necessarily accompanied by economic recession, such as the fourth quarter of 2018. On September 3, 2018, I published a paper titled “The Conflict of the Sino-US Cycles”, using a quantitative model to demonstrate in detail the laws of the US economic cycle, and pointed out that the simultaneous downward trend of the Sino-US cycles at that time indicated the upcoming The US market plummeted. Looking back, this paper was published at the peak of the U.S. stock market at that time. In the end, the U.S. market began a magnificent plunge, making the fourth quarter of 2018 the worst fourth quarter since the Great Depression in 1929.
Generally speaking, 2~3 short periods of 3.5-year Kitchin inventory constitute a 7-11-year middle cycle of Jugla’s capital replacement; more than 5 short periods of 3.5-year Kitchin inventory constitute a 17.5 The medium- to long-term period of more than five years; finally, more than 10 short periods of 3.5-year Kitchin inventory, which constitute a 35-year periodThe long period on the previous page is the Kangbo period that everyone may already be familiar with. It is worth noting that the length of the cycle operation is not static, and special social and economic events often interfere with the operation of the economic cycle. However, the operation of the economic cycle has its endogenous laws, and the central bank’s monetary policy choices have largely promoted the formation of this law. Therefore, even if unpredictable events interfere with the operation of the cycle, these events can only change the amplitude of the cycle fluctuations, but not the direction and trend of its operation.
In the first quarter of 2020, the new crown pneumonia epidemic plunged the global economy into the worst recession since the Great Depression in 1929, and the global central bank rescued the market with unprecedented intensity. Many people believe that the economy will recover quickly after the new crown pneumonia epidemic, so will enter a new cycle. Although on February 15, 2020, I authenticated by my real name in Weibo account “Honghao” warning The market crash will come within two weeks, and the severity of the crash will be analogous to the crash of October 1987 and the bursting of the Internet bubble in 2000. However, the subsequent development and consequences of this crash are still beyond My worst expectation.
At the same time, the new crown pneumonia epidemic seems to have brought the new short economic cycle from the fourth quarter of 2018 to the first quarter of 2019 to an early end. I think that the new crown pneumonia epidemic is probably just the beginning of the end of this economic cycle. After 2021, the economy will once again enter the stage of slowing down and recession, with the same Time companion follows huge market fluctuations. This is because the Fed’s unprecedented loose monetary policy will save a temporary recession, but it has no bottom line. Monetary policy will bring other economic consequences. These bailout costs will eventually be fed back to the real economy. For example, the inflationary pressure in the economy has soared, but growth has stalled, eventually forming a stagflation, or even hyperinflationary environment. . In such a stagflation environment, stocks and debts are double kills.
We also need to realize that although the operation of the cycle has a relatively stable time, in addition to the interference of the above-mentioned unpredictable events on the cycle, the inlay of the cycle also makes judging the beginning and the end of the cycle a pursuit of “fuzzy correctness”. “the art of.
The inlay of the cycle means that the operation of the cycle has neither a beginning nor an end. The end of the previous cycle gave birth to the beginning of the next cycle, the cycle repeats itself endlessly.
Business cycle and market forecast theory
How should we apply the law of cycle operation to market forecasts?
If the market is a reflection of the economy, then the cycle of market operation should also reflect the cycle of economic operation. As mentioned earlier, the market is a mirror of the economy, a distorted and exaggerated reflection of economic operations. This distortion of the market is reflected in the fact that the amplitude of market fluctuations is greater than that of economic fluctuations, but the trends are consistent. Nobel Prize Winner in EconomicsRobert·Shiller’s research shows that market volatility can only be affected by a small Explained by changes in economic fundamentals. The vast majority of market fluctuations cannot be explained by changes in economic fundamentals. If the basic unit time of economic cycle operation is about 3.5 years, and the longer economic cycle is composed of several short periods of 3.5 years nested with each other, then the time period of market price operation should also reflect this law.
My research found that there are approximately 850 trading days in a short period of 3.5 years. There are an average of 20.2 trading days per month, and 242.4 trading days in a year. After 3.5 years,A market cycle of 848.4 trading days was formed, that is, the aforementioned market cycle of approximately 850 days. A simple moving average of market prices calculated with this 850-day time length is very effective for predicting market trends.
For Shanghai Securities Composite Index (hereinafter referred to as Shanghai Stock Index), this simple 850-day The moving average has formed a point of support or pressure at every key inflection point in the past 30 years. For the US S&P Index, this 850-day moving average is the upward trend line of the past few decades. Every time the upward trend of the S&P index is broken, it is manifested in the relationship between the current price of the S&P index and this 850-day moving average: when the S&P index significantly falls below this 850-day moving average, it is often accompanied by serious financial crisis.
Generally speaking, the shadow of this 850-day moving average can be found in the operating cycles of major global market indexes.
For example, the 850-day moving average of the Dow Jones Index operates similarly to the S&P index. The operating cycle of the Hang Seng Index in Hong Kong, China reflects the superimposed operating law of three to five 3.5-year cycles. The moving average of the Hang Seng Index, made with a time length of 10.5 years (3 short-period nests of 3.5 years) and 17.5 years (5 short-period nests of 3.5 years), is the long-term upward trend line of the Hang Seng Index. When the global market plummeted in March 2020, each key point of the S&P index’s decline closely corresponds to this 850-day market cycle.
What’s more interesting is that the key points during the March decline, which are calculated from the 850-day cycle, correspond to the golden section of the index decline.
For example, twice the 850-day moving average, which is the 1700-day moving average of the S&P Index, is about 2,300 points. The position of 2300 points of this double 850-day moving average corresponds to the bottom of the plunge in March 2020. At the same time, it is also exactly equal to the lowest point during the fourth quarter of 2018-2300 points, which is also positive.Fortunately, the S&P index retreated to the 38.2% golden ratio point from its cycle peak of 3348 points. More interestingly, the triple 850-day moving average in March 2020 calculated from the 850-day cycle is approximately equal to 2000 points, which is roughly equal to the 50% golden ratio point of the S&P index from its cycle peak of 3348 points. The lowest point of the plunge in March 2020 appeared in the market on March 23, which happened to be near the 38.2% golden section retracement point of 2,300 points.
Note that although I have used a lot of technical analysis terms in the above discussion, what I am doing is not technical analysis. My 850-day moving average overlay forecasting system is derived from my own 3.5-year economic short-cycle nesting theory. .
When the market plunged in March 2020, these point calculation forecasts that I announced were all real-time and can be found on my Weibo . At that time, the predictions about the key points of the decline that I provided in real time on Weibo were generally correct in retrospect.
At that time, market prices had plunged several times outside the variance almost every week, and the probability of a plunge was one in several hundred million, or even one in billions. In the first case, based on my 850-day moving average based on the economic cycle theory, and the derived superposition period (two 850-day periods, three 850-day periods) and time units (minutes, hours, days, and weeks) , Month, year) deduced key market points, only about 3% deviation from the actual market price. The actual application and observation of these market cycle theories cannot be coincidental. This cycle-based trading theory has been continuously verified in the past decades of market history. It has guided investors in the epic plunge in 2020 and will continue to be effective in the future.
The evil consequences of the central bank’s choice of asymmetric monetary policy, apart from the growing capital market bubble and increasingly volatile market cycles, are long-term weak inflation and even deflationary pressures.
Greenspan’s former chairman of the Federal Reserve has always maintained the independence of the Federal Reserve from the US government. The Federal Reserve is not part of the US government, but a semi-public and semi-private institution. Even so, the US Congress still theoretically has the power to intervene in the Fed’s monetary policy choices through legislation and even dissolve this institution. Although the appointment of the chairman of the Federal Reserve is nominated by the president, Paul Volcker, one of the most famous chairman of the Federal Reserve, did not hesitate to break with the Reagan administration.Under the huge political pressure, it is necessary to raise interest rates and monetary tightening to alleviate the high inflationary pressure at that time. However, now the Fed’s political independence seems to have disappeared.
Book title: “Forecast: Economy, Cycle and Market Bubbles》
OF: Hong Hao
Publisher: CITIC Publishing Group
Author Profile:
Hong Hao, Managing Director and Head of Research Department of Bank of Communications International. Former executive general manager and global strategist of China International Capital Corporation, Morgan Stanley (Sydney, New York) consumer industry analyst, Citigroup (New York, London) Global strategist,is also the “Wall Street Journal”, “Financial Times” and “FinanceNew Weekly“, “Caijing” and other newspaper columnists.