The economic tide has come, how can it be successful, and now when the water is unknown, the data method is brilliant. Encourage everyone.
Editor’s note: This article is from the micro-channel public number “ground gas school” , Author: Chen grounded gas .
Many students encountered a requirement during work and interviews: data analysis should give “executable” suggestions. The word “executable” stumped many people. What makes it executable? I want to give an executable proposal, so I have to sell millions of items myself? I’m going to give the content operations an actionable suggestion, so I’d like to suggest that she “shock!” “Boiling!” I usually write: “The active rate is low, it needs to be high.” What to do! The above questions will be answered systematically today.
What is executable?
A lot of newcomers who do data, like to write: the activity rate is low, it is recommended to do it high. This is the typical “unenforceable” recommendation. “Establish” is a verb. One verb is left bare, and others are sure to ask: Who will do it? Who do you want? Where to do it? How to do it? How much? … a series of problems like a cannonball.
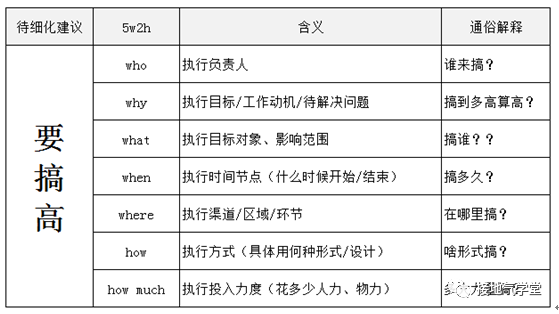
Facing this kind of doubt, inexperienced students will be fainted directly. However, experienced students know that there is a routine here, which is the 5w2h method. If you sort out the requirements according to this idea, it will be easy to understand: what details should be specific (as shown below)
However, after combing, there is a new question: how to derive these details from the data? Here we will talk about specific examples. Let’s take the example of online education. Suppose you are a data analyst of an online education institution. Although the world is blowing “online education 2020 is going to be hot”, it is the users of the money-spending circle that have not seen any increase in revenue. Your leader asks you to analyze “executable” suggestions! What to do? We can do this.
Step 1: Clear macro direction
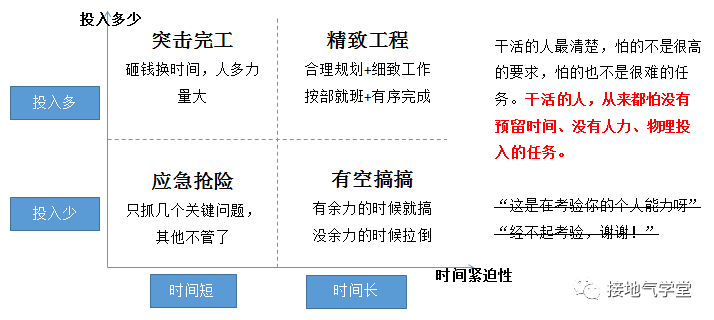
Although the specific plans vary widely. But the root cause is related to two things:
-
Time urgency: how long does it take to solve the problem
-
Resource richness: how much investment is there
Both methods for dry goodsImpact, as shown in the following figure.
So if you want to make your proposal feasible, you must first make sure that the macro judgment is correct:
-
How big is this matter, and to what extent is it done (why)
-
Is the matter going on now and how long can it be settled? (When)
Setting these two down, you can deploy resources later, so you can talk about the details
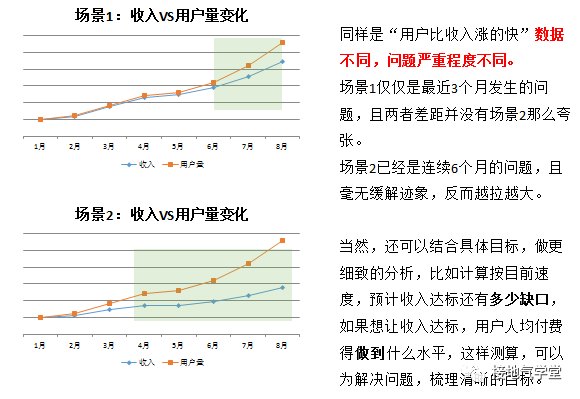
The scenario we have given is: when you see users spending money, your income will not increase. How about user growth and revenue growth? Through the trend analysis method, a preliminary judgment can be made. For example, the following two scenarios have different severity and urgency.
After trend judgment + target calculation, we can get a rough range. For example:
-
If the current trend continues for 3 months, the annual sales target will not be achieved
-
If you want to achieve your goals, you must turn things around in the next three months.
-
Need to make the per capita payment more than 1000
-
Need to drive at least 20,000 paid users
With this calculation, we have judged the macro situation, and we can fight for resources and lock down the scope of work.
Note: Many students who do data will be tangled at this step. The more you do data, the more you want to use a sophisticated model to demonstrate future trends. People who often do projects don’t do this at all. Instead, they tend to simply add, subtract, multiply, and divide accounts, and the language expression is very simple and straightforward: “Now it will be 5 million a month, and 10 million tasks will not be completed !!!” / p>
This is because the calculation here is to gain resources, and leaders need to agree. So: the more complicatedOn the contrary, the easier it is to mislead decision-making, the easier it is for people to focus their efforts on “the right thing to do with numbers” rather than “what should be done or not” The simpler the calculation, the easier it is for leaders with different knowledge backgrounds, ability levels, and cognitive levels to reach consensus. Eventually push things down.
So if the students who make data really want to make actionable suggestions, they must control their degree of entanglement. Keep in mind: “Persuading other talents is the first goal, and reaching consensus is the final result.” Don’t get yourself into details.
Step 2: Implementing the scope of operations
Clarified the direction. After locking resources, you can discuss how to work. This involves:
-
Who will do it? (Who)
-
Where to do it? (Where)
-
Who do you do? (What)
Three questions.
I really want the project to land. Choosing the responsible person is the most important part. Responsibility is unclear and things go unnoticed. Data analysis students often lack this sense of responsibility, but just a general recommendation: “To promote higher unit price products, strengthen payment incentives, and be more active users.” This advice is certainly not enough. For example, “do more active users” can not only increase the number of high-quality customer sources in the channel, but also allow the operation to do more active activities. It can also enable the management of some attractive products, and almost everyone’s work is related to it. Everyone is responsible is equal to everyone’s irresponsibility, so in general, it cannot be achieved.
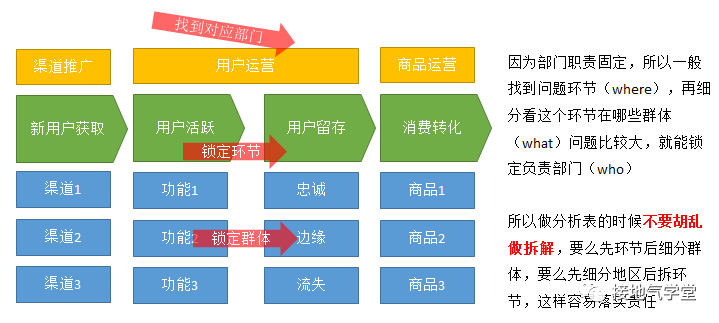
There are three problems here, but they are not so complicated when they are actually solved, because the organizational structure of an enterprise is often tied to tasks. Often locked the where or what, and the who together. Therefore, it is necessary to be familiar with the organizational structure and understand which link and which group each department corresponds to.
Online education institutions, the possible organizational structure and tasks correspond to the following figure:
So, for analysis, the most important thing here is to find the crux of the problem and focus on it. For example, the original problem: when you see more users, you do n’t see income increase. Several hypotheses can be derived:
-
Delivery issues: users themselves are not of high quality and there is no demand for courses
-
Promotion process issues: There are many promotion links (such as pulling the group first, listening to the live broadcast and then pushing paid courses), and the efficiency is low.
-
Operational issues: Low repurchase of students, no conversion of courses originally introduced for drainage
-
Curriculum quality: less attractive and less competitive
Then look for data separately, verify the hypothesis and deduce the core problem.
Note: This is where data analysts come in the most. No one. Because when general business departments discuss these issues, they will fall into the doctrine of the common people, and everyone accuses each other of trying to prove that they are OK. Or everyone is vying for resources and want to prove that their links are the most important. Especially in online education, this kind of serial business logic, the quarrel between upstream and downstream is more intense. As a third-party role, the data analyst can output more convincing answers.
Step 3: Lock execution details
Suppose in the second analysis, we made clear:
-
The content of the first question is not good, and it is not attractive to users
-
The secondary problem is insufficient delivery, which requires increased investment.
-
The product itself is not significantly different from competing products, so you are not afraid of competition.
Then, in the third step, we can focus on “how to design excellent content and get it right”. This analysis suggests that there is only one last step to get off the ground: what form is recommended.
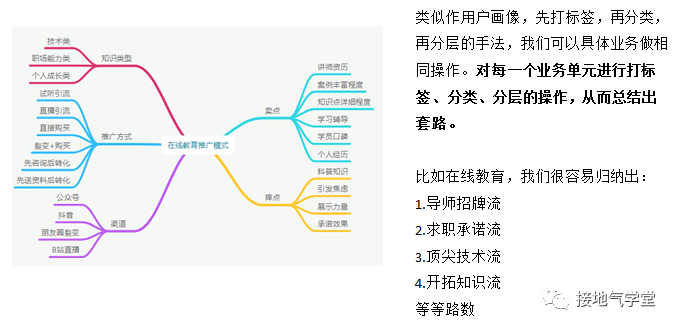
A lot of data analysis students are at this step. Often everyone is afraid when they hear “how to do it”. “I really can’t write a copy!” Actually, you don’t need to write it yourself. From the perspective of data analysis, the focus is not on a specific idea, but on which routine is more useful. The so-called: the direction is wrong, try hard in vain. Combining data to find a better routine is the way data analysis works.
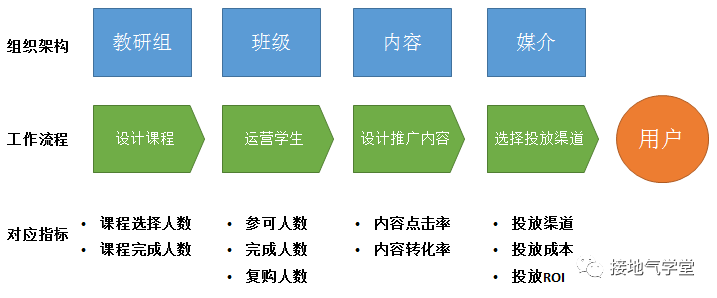
If you want to find a routine, you must first study the routine. Here the data analyst needs to know all the common business routines. For example, online courses have popular promotion methods:
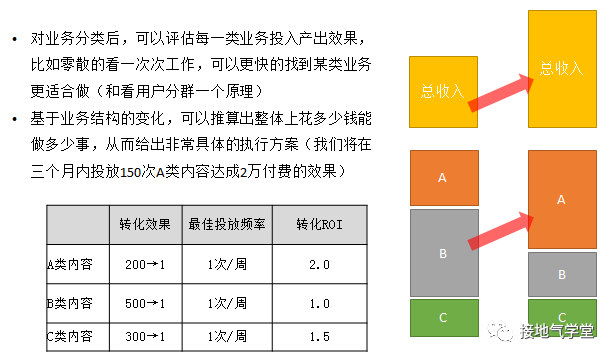
With the classification, we can analyze the promotion effect of each classification and find:
-
VS itself, which type of promotion is easier to achieve the effect
-
VS industry, which type is the most different from its peers?
-
VS time, which type can be used continuously
This way, when giving advice at the end, it can be very precise: we have done too little for XX, and we need to increase our efforts to XX level to achieve the goal. Rather than saying “do more content drainage”, we have already calculated how much performance we owe at the beginning, so we can calculate how much to spend and how much effect we can achieve based on each type of drainage ROI. Already given enough time and funding, there is also room for future creative ideas.
Summary
Throughout the entire process, you will find that solving the executable problem through data analysis is a progressive method from the top to the bottom. First make sure that the direction is correct, then implement it to the specific responsible person, then the specific object, and then look at the input and output of the specific operation category. As for the final idea, you can have it, without pulling it down. Anyway, given the time and expenses, as long as the average level is achieved, the difference can be paid. There is a feeling of “as long as you open the mine, you will win in the past.”
Of course, this progressive logic method is also a shortcoming of data analysis. From experience, data analysts’ solutions tend to be conservative and often lack creativity. These are the sequelae of being too rational. In fact, business success is often not the result of reason. Genius creativity, brave courage, invincible luck, extraordinary wit, seductive charm, unbeatable power may all be factors for success.
However, the unique appeal of data analysis is here. You will find that creativity, wit, and charm are innate, that power and luck are inaccessible, and that courage is a disaster when it is added to a fool. Only data analysis capabilities can be continuously improved through learning, training, experiments, and records. Therefore, feasibility suggestions based on data may not be adopted, but will only be paid more and more attention. The economic tide has come, how can it be successful, and now when the water is unknown, the data method is brilliant. Encourage everyone.
-
-
-
-
-
-