On May 29th local time, the US Bureau of Economic Analysis released the latest issue of consumption data. Both the spending side and the income side showed the severe impact of the epidemic and related response policies.
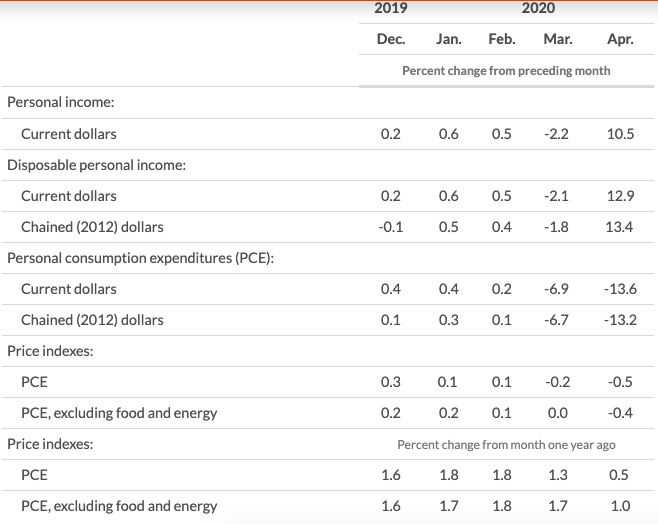 In the US, personal spending in April fell by 13.6% month-on-month, but monthly income increased by 10.5%. It is worth noting that the US Congress has come up with a number of programs to send money to the public, including payment transfer projects, unemployment benefits subsidies, and salary protection plans.
In the US, personal spending in April fell by 13.6% month-on-month, but monthly income increased by 10.5%. It is worth noting that the US Congress has come up with a number of programs to send money to the public, including payment transfer projects, unemployment benefits subsidies, and salary protection plans.
However, the data released by the Bureau of Economic Analysis on the same day showed that the personal saving rate in the United States reached a staggering 33% in April, the highest since the statistics began in the 1960s New record.
As an important economic indicator, the personal saving rate measures the proportion of deposits in residents ’disposable income. According to data released by the Bureau of Economic Analysis, personal savings projects have remained between 1.2-1.3 trillion U.S. dollars in the six months before February of this year, rising to 2.1 trillion U.S. dollars in March and 61,000 in April. One hundred million U.S. dollars. Personal disposable income has fluctuated between 16-18 trillion dollars during the same period.
Personal savings rate refers to the percentage of savings in disposable income. The 33% ratio is the highest level since the US Bureau of Economic Analysis began tracking surveys in the 1960s and exceeded the personal savings rate during the global financial crisis. In March this year, the number was only 12.7%.