Today we will revert to the working scenario and see how to write the data analysis report.
Editor’s note: This article is from the micro-channel public number “ground gas school” , Author: Chen grounded gas .
Many students like to ask: Is there a data analysis report template that I can copy? In fact, if you master the method of writing a report, you don’t need a template copy at all. The so-called templates, for the sake of encyclopedia, often have many chapters. It is estimated that such a report in real work not only exhausted himself, but also caused the sudden death of listening to the report. Today we will revert to the working scenario and see how to write the data analysis report.
There are two basic models for data analysis reports:
-
You asked me to answer: there are clear questions to answer
-
I say you listen: there is no clear question, you need to interpret it from regular data
First talk today: you ask me to answer. Because there are clear questions, the answers are more focused and easy to explain.
1 Elementary report
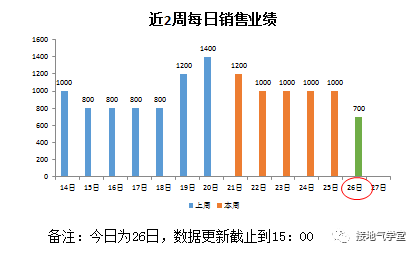
Please look at the picture above, and then answer it yourself:
-
What was the sales performance yesterday
-
What is the sales performance tomorrow
-
Too much sales today
Thinking Exam 1 points bell
Interpretation of Question 1
Everyone remembers this standard: one question and one answer, positive answer, simple and clear. Yesterday’s sales performance is very clear, just answer it. Answer 1: Yesterday’s sales performance was 10 million. OK, pass.
Interpretation of Question 2
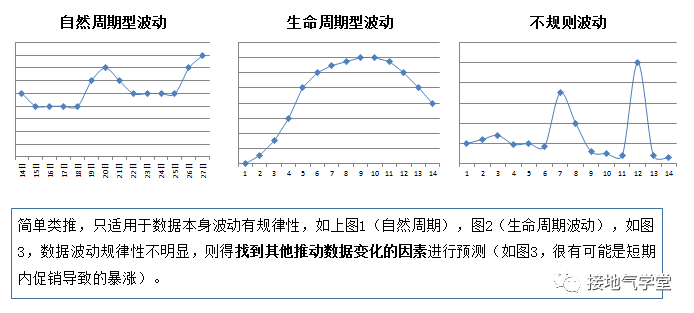
Be aware of time status. Tomorrow, it has not happened yet, so it is a predicted value. When it comes to forecasting, you have to make it clear: forecasting methods, forecasting basis, and forecasting results. There are many prediction methods, and the amount of data required is also different.Just have dinner. There is no reason for the leader to ask casually, you screamed: “Stay! Hold me, three months later my super-accurate accurate artificial intelligence model will be fine …” So you can simply reply, A: According to the rules of last week Look, tomorrow is expected to be 12 million, 20% more than today.
Of course, this simple guess is also prerequisite, see below:
Interpretation of Question 3
Before answering question 3, think about it. Is today’s value a predicted value or an actual value? Before 3 o’clock is the actual value, after 3 o’clock is the predicted value. So when you answer, you need to distinguish the status. Answer: As of 3pm, the actual value is 7 million. According to the trend, it is estimated that 14 million.
Primary report scenarios are common in the office, often the leader or the business department casually ask for the number. At this time, there is no classification dimension, only a single indicator, so as long as the time status is clearly distinguished, it can be answered.
2 Intermediate report
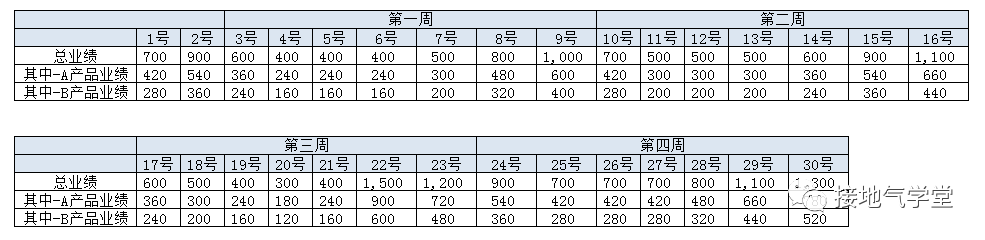
Please see the picture above to answer:
-
How was your performance last month?
-
Why is the third week’s performance down compared to the previous two weeks?
Interpretation of Question 1
Think before answering question 1:
-
How many indicators are there?
-
How many dimensions are there?
-
How many questions do you ask first?
There is only one indicator here: performance, but there are three classification dimensions: week, day, and product. Many newcomers blurt out: two categorical dimensions, time and product. Please note that time is divided into weeks and days. If you do not distinguish clearly, the answer will be confusing. Because this indicator obviously has a weekly cycle trend, so this weekThis dimension cannot be omitted.
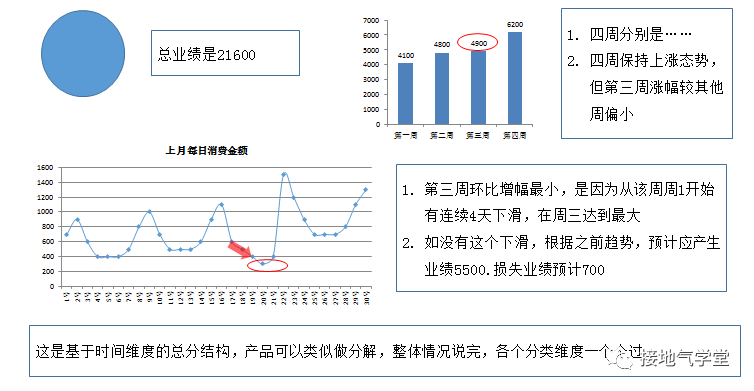
There is obviously more than one problem here. Because of the classification dimension, there is a difference between whole and part. We can’t throw a “total performance is XXX” crossover as we did in the preliminary report. When you meet the whole and the part, everyone remembers this order: the whole-partial-case order. When explaining the locality, if there are multiple classification dimensions, generally speaking one after the other. For the example at hand, you can say:
Interpretation of Question 2
Think before answering question 2:
I want to answer a number or one thing?
Question 2 asks why. Note that the cause refers to a problem that specifically affects performance, not the number itself. Many newcomers will make mistakes here and answer directly: “The decline is due to very little performance on Tuesday, Wednesday, and Thursday.” Answering this way is tantamount to nonsense. Find the problem behind the numbers. It is often necessary to do some in-depth research here, such as what the weather was like, what happened, and what controls the business did. It cannot be answered by relying on only one piece of data.
Of course, analyzing the cause requires a specific analysis method. Here you can refer to Mr. Chen’s previous article, but as a report, no matter how many intermediate methods there are, the final report results should be clear. “This problem was caused by XX.”
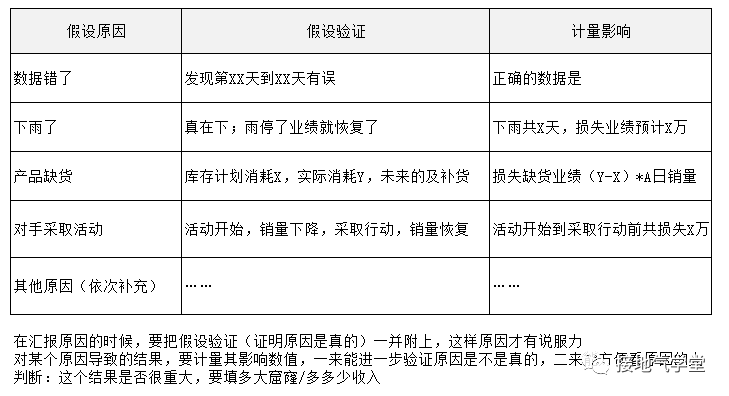
After we have collected the real reasons, we can answer. Note that as a data analysis report, simply saying, “Because it rained in the third week” is difficult to convince the public. It is necessary to make a quantitative assessment of the cause of the problem and specify the size of each influencing factor in order to convince the public. Similarly, if the data is wrong, indicate what the correct data is. If the business has control measures, indicate the start and end time of the control measures. The common situations are as follows, you can refer to:
3 Advanced report
We often say: In the field of data analysis, there is no advanced method, only difficult problems. If all the issues can be as clear and clear as elementary and intermediate reports, naturallyThe answer is clear. However, the actual work is: the problem itself is ambiguous, and it is inexplicable. This brings the difficulty of the report from the beginning to the advanced. Such as the following questions:
-
Why is this month’s poor performance?
-
What’s wrong with our product experience?
-
Why do my leaders hear complaints from customers?
Newcomers are especially easy to follow here! These questions seem to be clear, but they are a complete mess. The biggest difference from the intermediate report is that the intermediate report is based on data to talk about issues, but the above does not even have basic facts and data. Keep in mind in this case: first ask if it is, then why. Because: talk about cases from probability, talk about details from the whole, talk about the status quo from the data, talk about judgment from the standard, all are hooligans! When we do data analysis, we need to use rationality to fight sensibility and logic to fight emotions. These feelings, emotions, and impulses are our enemies. We must resolutely eliminate them!
Interpretation of Question 1
To answer question 1, you must first set the facts, then set the standard, and then analyze.
Can answer:
-
This month’s performance value is XXX
-
The criteria for judging good and bad are (last month, same month last year, KPI indicators …)
-
Compared with the standard, the degree of difference is (non-existent, light, medium, heavy)
-
This (light, medium, heavy) level difference is because …
-
If the question doesn’t exist, just don’t answer it
Interpretation of Question 2
To answer question 2, you must first define the data indicators, then set the standards, and then analyze.
-
The assessment index for user experience is XXX
-
The good / bad criterion for these indicators is XXX
-
Compared with the standard, the problem is XXX
-
The extent of the problem is (non-existent, light, medium, heavy)
-
This (light, medium, heavy) level problem is because …
-
If the question doesn’t exist, just don’t answer it
Interpretation of Question 3
Answering question 3 is the same. It’s just that question 3 is even worseReliable. Face problem 3, implement it first:
-
Who is my leader
-
When, where, and in what way does my leader
-
Which user did you hear and what complaints about it?
Implementing specific issues, first see if this is really the case, or whether it is subjective, or hearsay, or not, or no wind and waves, and then analyze it.
4 Summary
We often say: high-quality questions bring high-quality answers. In response to the report I asked you, the biggest question is often that the question itself is unclear, mixed with each other, and it is difficult to distinguish between true and false, which makes the report very awkward.
Everyone recalls that, whether at work or in life, the problems we blurt out are often very vague and casual. So we must resolve the issue resolutely, and follow-up reports are ready. If you are interested, this collection of 60 is watching,
-
-
-
-
-
-
-